Most leadership teams agree: technology is the strategy. The hard part is turning that sentence into a plan that actually guides decisions, budgets and trade-offs — not another long feature list that gathers dust. This guide gives you a practical 90-day playbook to build a three-layer roadmap (market → product → tech) that ties strategic bets to owners, measurable value and manageable risk.
Why this matters now: the cost of getting tech choices wrong is real. The average cost of a data breach reached a record high in 2023 — about US$4.45 million — so security, compliance and architecture belong on the roadmap, not off to the side. Source: IBM Cost of a Data Breach Report 2023.
And on the upside, smarter tech choices pay off quickly. Personalization and AI-driven customer experience programs have driven measurable revenue and retention gains — empirical work shows customer-focused AI can lift revenue and retention metrics in the mid-single to double-digit range (HBR explores increases of roughly 6–10% from experience-led AI initiatives). Source: Harvard Business Review.
Read on and you’ll get: a clear template for the three-layer roadmap, the time horizons to use, how to feed the map with live signals (competitive intel, telemetry, security posture, AI inputs), and a governance cadence that keeps the plan honest. We’ll end with an actionable first 12-week program — weeks 1–2 for discovery, weeks 3–6 to draft and quantify, and weeks 7–12 to run pilots and lock in the scorecard — so you can move from ideas to evidence in a quarter.
This is practical, not theoretical. If you want a roadmap that helps you pick better bets, stop wasting runway, and actually measure progress — start here.
Start with outcomes: design a three-layer roadmap that aligns markets, products, and tech
Map the market–product–tech stack on one page (why three layers beat feature lists)
Build a single, one‑page view with three horizontal lanes: Markets (target segments, buyer outcomes), Products (capabilities and value propositions) and Tech (platforms, dependencies, security). The discipline of linking each product capability to a market outcome and the enabling technology forces clarity: every work item must answer which customer need it serves and what tech investment makes it feasible. This kills feature‑list thinking where teams ship functionality without a clear revenue or retention hypothesis.
Time horizons that fit strategy: 0–6, 6–18, 18–36 months
Use three horizon bands to reflect certainty and funding approach. 0–6 months captures near‑term commitments and must contain deliverables that preserve current revenue and customer health. 6–18 months is the horizon for validated bets and pilot scaling. 18–36 months holds directional investments and architectural runway that require exploration funding and measurable learning milestones. Framing initiatives by horizon clarifies which items need tight project management and which need experiments and staged investment.
From strategic bets to budgets: tie each line to owners, risks, and value
Make each roadmap row actionable: assign an owner, estimate budget or resource allocation, list top risks and the explicit value hypothesis (how the item moves a metric that matters). Owners drive decisions and escalations; budgets connect intent to funding; risks drive mitigation. Keep the template compact (owner | budget | top risks | expected impact) so governance meetings can triage quickly and reallocate capital toward the highest evidence‑backed bets.
Metrics that matter: time-to-market, R&D cost per win, NRR, security posture
Track a tight scorecard that maps to outcomes in the three lanes. Core indicators should include time‑to‑market (how quickly ideas reach customers), R&D cost per win (development spend per validated commercial outcome), Net Revenue Retention (NRR) for market success, and a security posture metric to reflect tech risk and buyer trust.
“Protecting IP and customer data materially de-risks investments: the average cost of a data breach in 2023 was $4.24M, GDPR fines can reach 4% of revenue, and adopting frameworks such as ISO 27002, SOC 2 and NIST both defends valuation and boosts buyer trust. On the retention side, AI-driven customer success can lift Net Revenue Retention (~NRR) by ~10%—making these security and retention metrics pivotal for roadmap prioritization.” Portfolio Company Exit Preparation Technologies to Enhance Valuation — D-LAB research
Keep the scorecard compact and connected to each roadmap line so funding, priorities and de‑risks can be decided using evidence rather than anecdotes.
With a clear, outcomes‑oriented map, three horizons and a lean scorecard, the roadmap becomes a living contract between product, engineering and go‑to‑market — next, feed it with continuous signals so every line is re‑validated against customer behavior, competitor moves and technical health.
Feed it with live signals: AI-powered inputs that de-risk decisions
Competitive intelligence for product leaders (avoid obsolete bets)
Make the roadmap reactive by feeding it a continuous stream of market and competitor signals: product releases, SDK changes, patent filings, pricing moves and M&A activity. Automate ingest with news parsers, changelog monitors and dependency scanners, then surface ranked actions to product owners so they can kill, defer or accelerate items based on risk of obsolescence and competitive positioning. Use ML models to cluster similar competitor features and score obsolescence risk for components you rely on — that score becomes a trigger for architecture work or for moving a feature between time horizons.
“Resolution: AI shortlists most impactful innovations, establishes a technology implementation roadmap, provides insights on competitors products, and assesses risk of obsoletion on new technology investments.” Product Leaders Challenges & AI-Powered Solutions — D-LAB research
Operational tip: convert the intelligence stream into two outputs — (1) immediate red/amber/green flags for governance meetings, and (2) a rolling list of validated opportunities that map directly to your Markets–Products–Tech lanes so prioritization is evidence‑driven, not anecdotal.
Customer sentiment and usage telemetry to prioritize features
Make customer behavior the leading input to your product lane. Instrument feature events, user flows and conversion funnels so you can tie every capability to adoption, retention and revenue signals. Combine qualitative sources (support transcripts, NPS, interviews) with quantitative telemetry (DAU/MAU, feature activation, time‑to‑value) and rank backlog items by expected impact on core metrics like activation and retention.
Best practice: build automated experiments that convert telemetry into evidence — for example, run small rollouts, measure feature engagement cohorts, and require a lift threshold before moving from pilot to scale. When telemetry and sentiment diverge, prioritize follow‑up research (session recordings, targeted surveys) to close the evidence gap.
Technical debt and cybersecurity as roadmap tracks (ISO 27002, SOC 2, NIST 2.0)
Treat technical debt and security as first‑class lanes on the roadmap, not backlogs that surface only when things break. Maintain a health dashboard that captures debt hotspots (modules with the most defects, longest PR lead times), dependency risks (unmaintained libraries, vendor EOL) and security posture (open incidents, compliance gaps, patch SLAs). Link remediation work to market risk: e.g., a vulnerable third‑party dependency that blocks a target market or an upcoming audit should elevate into the 0–6 month band.
Operationalize frameworks as roadmap items: map ISO 27002/SOC 2/NIST milestones to concrete deliverables (asset inventory, logging, incident response automation) and measure progress against those checkpoints so security funding and product launches are coordinated.
Prepare for machine customers and edge demand shifts
Anticipate non‑human buyers and edge usage by collecting machine telemetry (API usage patterns, latency, error rates) and modeling cost-to-serve at scale. Add signals that detect automated purchasing behaviors, high‑frequency API callers, and edge‑latency hotspots so you can prioritize API hardening, rate limits, billing changes and offline sync capabilities.
Design experiments that simulate machine‑scale traffic and edge conditions early: failure modes discovered in staging under realistic machine loads should move items up the roadmap and trigger architecture runway investments.
Feed these live signals into your monthly prioritization loop so strategic bets are continuously re‑scored against real market, customer and technical evidence. With this steady input, decisions shift from opinions to data — and the next step is to lock those decisions into a governance and funding cadence that enforces accountability and funds the highest‑confidence bets.
Run the cadence: governance and funding that keep the roadmap real
Monthly decisions, quarterly resets: who decides what, when
Set a two‑speed governance rhythm: a compact monthly forum for tactical prioritization and unblockers, and a broader quarterly review for strategic reallocation and horizon resets. The monthly meeting (product council or roadmap triage) should focus on go/no‑go flags, capacity tradeoffs and short‑term risk mitigation; the quarterly session should re‑score bets against OKRs, reassign budgets and update the three‑layer map. Regular business reviews that connect operational metrics to roadmap choices keep decisions timely and aligned with outcomes (see guidance on quarterly product planning and business reviews: https://dragonboat.io/blog/quarterly-planning-cadence-aligns-agile-teams/ and https://workingbackwards.com/concepts/quarterly-monthly-business-reviews/).
Explore vs exploit funding model and stage gates (kill, pivot, scale)
Partition funding into exploit (scale proven bets) and explore (small, time‑boxed experiments). Use staged funding with clear gates: early gates evaluate learning and de‑risking milestones; later gates evaluate commercial metrics and scale readiness. That structure lets you fail fast on low‑evidence experiments while giving runway to strategic options that need more discovery time. Formal stage‑gate decisions — criteria‑based go/no‑go checkpoints — remain a proven mechanism for stopping projects that lack evidence (see Stage‑Gate practice and idea‑to‑launch systems: https://www.designorate.com/stage-gate-new-product-development-process/ and the classic Stage‑Gate literature summary: https://onlinelibrary.wiley.com/doi/full/10.1002/9781444316568.wiem05014).
Architecture runway and dependency maps to protect velocity
Treat technical runway and dependency visibility as governance inputs. Maintain an explicit architecture backlog of enablers that extend the runway and a dependency map that shows teams, APIs, and long‑lead items. Prioritise runway work in the same cadences as product funding so architecture is not perpetually deferred. The concept of architectural runway and enablers — backlog items that prepare systems for future features — is a practical way to keep teams productive while evolving the platform (see SAFe definitions on architectural runway and enablers: https://framework.scaledagile.com/enablers and https://framework.scaledagile.com/glossary/).
Value evidence required: what data promotes an idea
Define the minimal evidence package required to move work from exploration into exploit. Typical evidence pillars: (1) market signal (intent, pipeline or willing‑to‑pay validation), (2) customer evidence (A/B lift, cohort engagement, qualitative validation), (3) technical readiness (prototype, integration feasibility, dependency clearance), and (4) risk posture (security/compliance checklist). Require owners to submit a one‑page evidence brief to the gate: hypothesis, metric lift required, confidence level, key risks and remediation plan. Basing funding decisions on repeatable, transparent criteria reduces bias and increases capital efficiency (see lean portfolio and evidence‑based funding approaches: https://framework.scaledagile.com/lean-portfolio-management/).
When monthly triage, stage gates, runway priorities and evidence rules are working together, the roadmap stops being an aspirational slide and becomes a living decision system that directs money, people and architecture toward measurable impact — which makes it straightforward to translate those priorities into specific patterns and KPIs for the next planning layer.
Thank you for reading Diligize’s blog!
Are you looking for strategic advise?
Subscribe to our newsletter!
Two high-impact patterns: manufacturing vs digital product roadmaps
Manufacturing priorities in 2025: factory optimization, predictive maintenance, supply chains, sustainability, digital twins, additive
Manufacturing roadmaps must prioritize operational resilience and unit economics. Focus on three classes of initiatives: (1) production floor optimization (throughput, quality and OEE improvements), (2) asset reliability (predictive maintenance, condition monitoring and spare‑parts strategy), and (3) supply‑chain resilience and sustainability (inventory optimization, supplier diversification, energy and emissions tracking). Treat digital twins, advanced analytics and additive manufacturing as enablers that reduce cycle time and rework when deployed against concrete use cases rather than as standalone R&D projects.
Digital product priorities: AI customer success, recommendation engines, dynamic pricing, AI sales agents
Digital product roadmaps should orient around customer value and monetization velocity. Prioritise features that improve activation, retention and monetization: AI‑driven customer success to reduce churn, recommendation systems to lift average order value, dynamic pricing to capture value, and AI sales automation to scale outreach and qualification. Balance new user growth features with investments in platform reliability, data quality and model performance so that AI initiatives reliably translate into measurable revenue or retention gains.
Example KPIs and targets to set for each pattern
Translate each roadmap line into a short scorecard. For manufacturing, typical KPIs include throughput per shift, overall equipment effectiveness (OEE), mean time to repair (MTTR), defect rate, on‑time delivery and energy per unit. For digital products, track activation rate, time‑to‑value, feature adoption rate, retention cohorts, net revenue retention (NRR) or retention‑adjusted revenue, conversion rate and model inference latency/accuracy for AI features. Set targets relative to baseline (e.g., % improvement vs current quarter) and require an owner and a measurement plan for every KPI.
Use these two patterns as lenses when choosing pilots and allocating funding: pick one high‑impact operational pilot for manufacturing or one monetization/retention pilot for digital products, define clear KPIs and success thresholds, then use those outcomes to scale work across the three‑layer roadmap. After pilots generate evidence, convert winning items into funded lines and install the governance and scorecards that keep momentum and accountability in place.
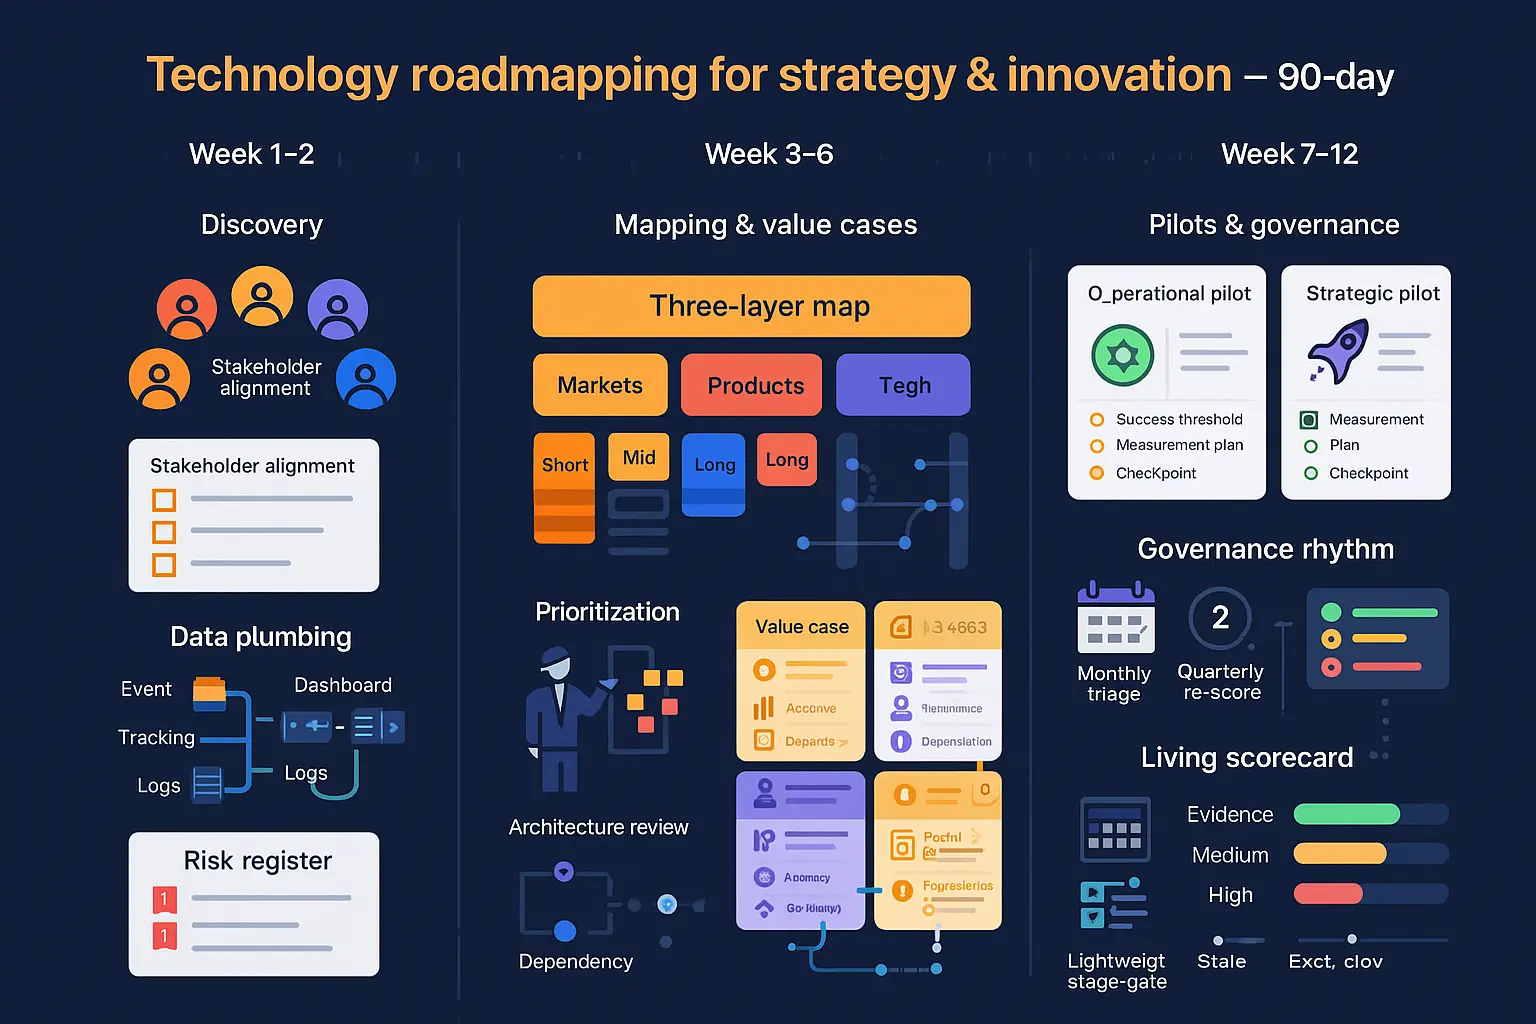
Your first 90 days: templates, workshops, and pilot picks
Week 1–2: discovery, data plumbing, and risk register
Start by aligning stakeholders and creating a compact discovery checklist: who are the decision owners, what markets and customers matter most, what existing measurement and data sources you can access. Run short stakeholder interviews (product, engineering, sales, operations, security) to surface assumptions and known risks.
Concurrently, establish the minimal data plumbing required to validate hypotheses: event tracking, basic dashboards, access to logs, and a simple experiment telemetry feed. Create a living risk register that captures technical, commercial and compliance risks and assigns an owner and mitigation step for each item.
Week 3–6: draft the three-layer map and quantify value cases
Using the inputs from discovery, draft the one‑page three‑layer roadmap (Markets / Products / Tech) and slot initiatives into the short, mid and long horizons. For each lined item, require a short value case: the hypothesis, the metric it moves, the owner, a rough resource estimate and the top two dependencies.
Workshops to run in this window: a rapid prioritization session to score initiatives by potential value and risk; an architecture review to identify dependencies and runway items; and a data readiness workshop to confirm measurement plans for top candidates.
Week 7–12: run two pilots, install governance, publish the scorecard
Pick two pilots: one that is likely to deliver operational impact quickly, and one that is a strategic, higher‑uncertainty bet. Design each pilot with a clear hypothesis, a success threshold, a measurement plan and a short cadence for checkpoints. Keep pilots small, time‑boxed and resourced with a single accountable owner.
Install the governance rhythm you will carry forward: monthly triage meetings for tactical decisions, a quarterly re‑score for strategy, and a lightweight stage‑gate template for moving pilots to scale or sunset. Publish a living scorecard that maps each funded line to 2–3 KPIs and the current status of evidence against the hypothesis.
Templates to copy: 1-page roadmap, backlog taxonomy, KPI scoreboard
Provide teams with three reusable templates to accelerate execution:
1-page roadmap — three lanes (Markets / Products / Tech), three horizon columns, and at-a-glance owner | budget | top risk | expected outcome.
Backlog taxonomy — canonical labels to classify work (e.g., exploration, runway, compliance, customer request, technical debt), priority band, estimated effort, dependency map and owner.
KPI scoreboard — a compact dashboard for each initiative listing hypothesis, leading and lagging metrics, current value delta, confidence level and next experiment or milestone.
End your 90 days by turning pilot learnings into funded lines on the one‑page roadmap and by embedding the scorecard and governance cadence into regular operations so decisions remain evidence‑led and momentum continues into the next cycle.