READ MORE

Risk and Quantitative Analysis BlackRock: what the team does, the skills that win, and how AI raises the bar

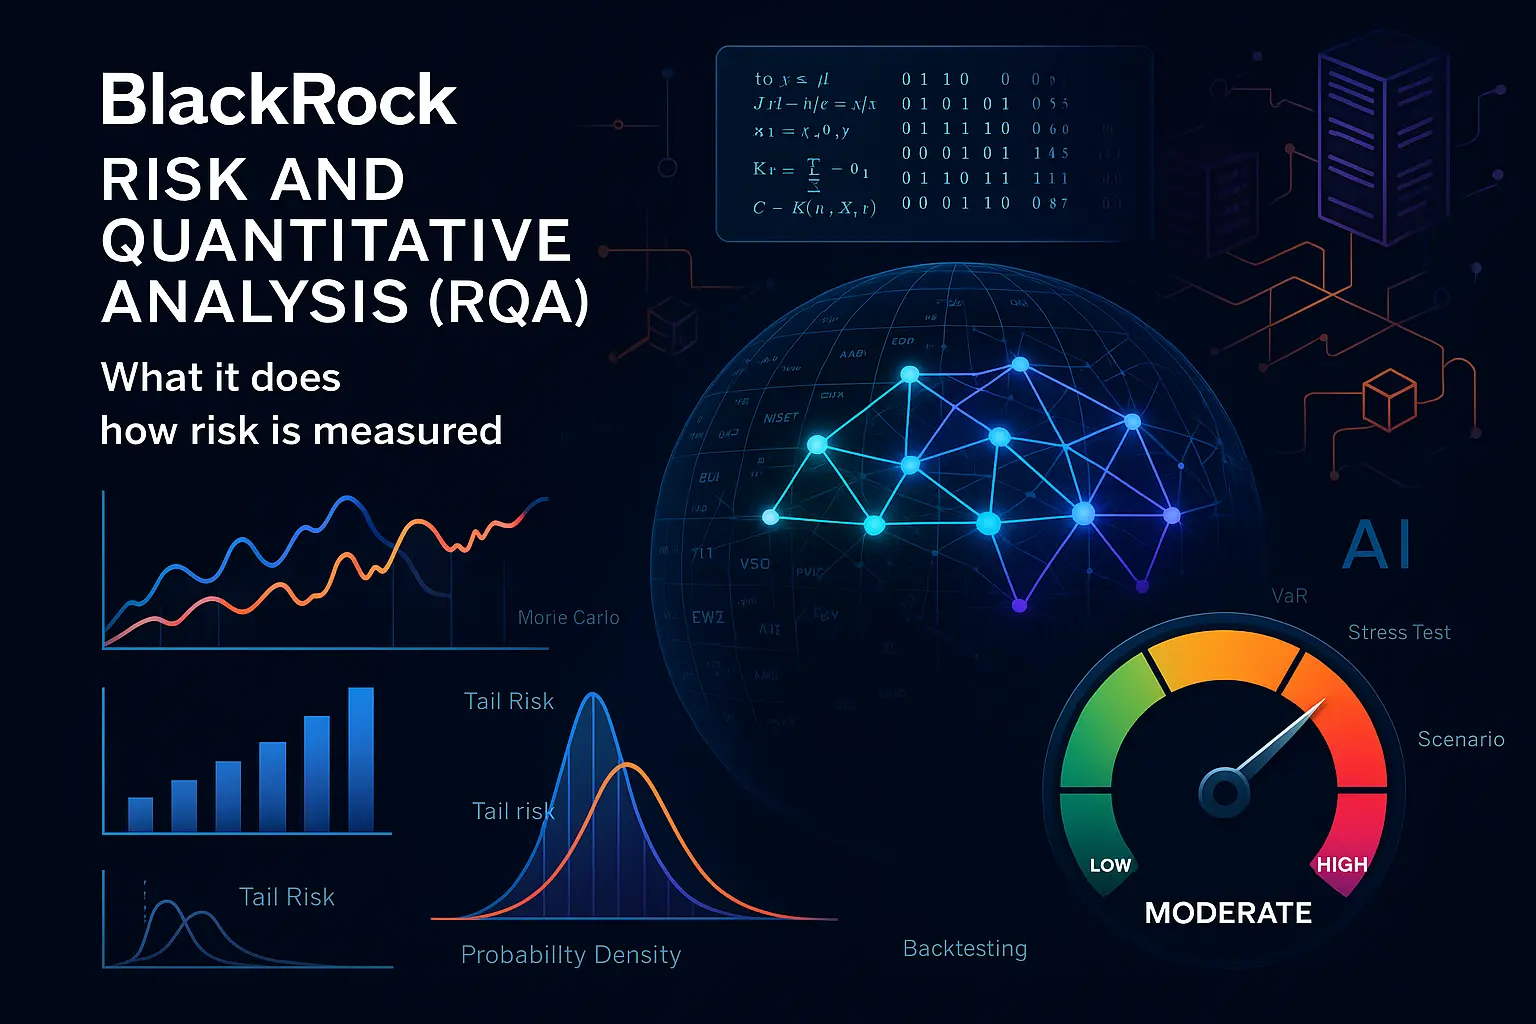
Risk and Quantitative Analysis (RQA) at BlackRock sounds like a scary lab full of models and jargon — but at its core it’s simple: the team helps people make better decisions about money. They measure what can go wrong, explain why it matters, and give clear options so portfolio managers, traders and clients can act with confidence. In this article we peel back the curtain on what the RQA team actually does, how people get hired, and why AI is reshaping the job.

If you’re curious about the day-to-day work, this piece translates the technical into plain English. You’ll see how typical RQA tasks — from measuring liquidity and counterparty exposure to validating pricing and stress scenarios — feed into real decisions, not just reports. We’ll also map the common career paths (summer analyst → analyst → associate), the technical skills that get you noticed (statistics, Python/R, data pipelines), and the non-technical signals that hiring managers prize (clear judgment, reproducible work, and concise communication).

AI isn’t a distant threat or a magic bullet — it’s a tool that raises the bar. In practice, it speeds up routine monitoring, helps turn VaR and stress outputs into plain-language narratives for clients, and demands stronger governance around data and models. That changes what “good” looks like: faster throughput, higher expectations for explainability, and a premium on people who can pair domain knowledge with reproducible code.

Read on for a practical playbook: what the RQA team at BlackRock does, the concrete skills that win interviews, where AI will help (and where it can’t), a 2025 risk checklist for stressed markets, and a compact 60‑day self-study plan to get you interview-ready. Whether you’re aiming for your first quant role or trying to level up inside risk, this introduction is the map — the rest of the article is the directions.

What RQA does at BlackRock (in plain English)

Investment, liquidity, and counterparty risk: how they’re measured and escalated

At a practical level, the RQA group watches the portfolio through three lenses: how much money could be lost if markets move (investment risk), how easy or hard it would be to trade or exit positions when there’s stress (liquidity risk), and whether the people or firms you trade with can honour their side of a deal (counterparty risk). They run standard metrics (think probability-based loss estimates, concentration checks, and short‑term cash/flow stress tests), flag anything outside agreed tolerances, and turn those flags into action. Action can be as simple as an email to a portfolio manager explaining why a limit was hit, or as material as an escalation to senior risk or trading teams with recommended mitigations (hedges, size reductions, or re-pricing). The goal isn’t to block activity but to make trade-offs visible so decisions are made with the risk consequences front and centre.

Model risk and validation: keeping models explainable and governed

RQA builds and reviews the models that estimate those risks — everything from models that estimate daily loss to those that project cash flows under extreme scenarios. Validation is about two things: checking that a model actually does what it claims, and making sure humans can understand the answers. That means independent testing, backtests versus historical outcomes, sensitivity checks (what breaks if an input changes), and documenting assumptions so the business can explain model outputs to clients, auditors, and regulators. When models change, RQA runs controlled experiments and records the change rationale so the firm can trace why a number looked different this quarter versus last.

Data and tooling: Aladdin, eFront, stress tests and scenario design

Risk work depends on clean data and reliable tools. RQA integrates position, trade, and market data into systems that produce the risk metrics teams use every day. They design scenario suites — from plausible market moves to extreme shocks — and automate the plumbing so stress tests can run quickly and consistently. In practice that means owning data quality checks, building dashboards that aggregate exposures across strategies, and coordinating with platform teams that run the central portfolio and accounting systems. The better the inputs and the tooling, the faster and more defensible the answers that reach portfolio managers and clients.

Partnering with PMs, traders, and clients: risk as a decision enabler

RQA is not a separate island — it’s a partner. Analysts sit with portfolio managers and traders to translate risk numbers into tradeable insights: where is the portfolio crowded, which instruments will behave poorly in a stressed market, and where are liquidity buffers likely to run thin? They also help craft client-facing explanations: turning technical outputs (VaR, stress losses, limit breaches) into clear narratives about why a portfolio changed or how it would behave in a downturn. That consultative role is what moves risk from a compliance checkbox into a decision-enabling function that helps protect performance and client trust.

All of these activities—measuring and escalating risks, validating the math behind the metrics, maintaining the data and systems that create those metrics, and working shoulder-to-shoulder with the investment teams—are the core of what RQA delivers. If you want to understand how people get into this work and what skills actually make a difference on the desk, the next part breaks down typical roles, the technical and judgment skills hiring managers value, and the interview signals that predict success.

Roles, skills, and interview signals for RQA candidates

Entry paths: summer analyst, analyst, associate, and typical rotations

Common entry points into RQA are internship/summer analyst programs, full-time analyst roles out of university, and associate positions for candidates with a few years’ experience or a relevant master’s. Early-career hires usually focus on data preparation, routine risk reports, and supporting model runs. Associates and more senior analysts take on model development, independent validation, and lead escalations.

Rotations are a big part of development: new hires frequently cycle between desk-facing risk, model validation, data engineering, and stress-testing teams. Those rotations expose you to trading workflows, portfolio construction, and client reporting — which speeds both technical skill growth and business judgment.

Core skills: statistics, Python/R/Spark, fixed income and equity microstructure

Technical foundation

Domain knowledge

Complementary skills

What hiring managers look for: judgment, communication, reproducible analysis

Hiring managers are less impressed by memorized formulas and more by how you apply tools to real trade-offs. The three signals that consistently stand out:

Practical interview evidence that convinces managers includes a short portfolio of scripts/notebooks on GitHub (clean READMEs, small test cases), concise slide decks for a risk memo, and examples of when you escalated or de‑escalated based on data.

Mini-case prompts to practice: limit breach triage, VaR vs. stress, model change logs

Practice these mini-cases — they mirror what interviewers ask and sharpen the skills above.

When practicing, timebox your answers (5–10 minutes for short cases) and focus on a reproducible, explainable workflow: state assumptions, run targeted checks, and produce a one-paragraph recommendation. That structure demonstrates the judgment and communication hiring teams prize.

With those role expectations and skills in mind, the natural next question is how new tooling and automation are changing the shape of these jobs and raising the baseline for both technical and communication capabilities — we’ll explore that evolution next and what it means for candidates preparing to stand out.

AI’s real impact on Risk and Quantitative Analysis

Risk ops co‑pilots: automate limit monitoring, incident write‑ups, and board packs

AI is turning routine risk operations from a frantic, manual workflow into an orchestrated process. Smart monitors can watch limits, reconcile positions, and draft triage notes the moment a threshold is hit — freeing analysts to judge and advise rather than hunt for root causes. That means faster incident timelines (detect → reproduce → recommend) and cleaner board packs built from reproducible queries and templated narratives. In practice you’ll see co‑pilots that summarize why a breach occurred, propose immediate mitigations, and assemble the slides and tables senior stakeholders need to sign off on decisions.

Client‑facing explainability: turn VaR and stress results into clear narratives

One of the biggest wins from AI is improved translation: turning math into stories clients and PMs can act on. Natural language generation layered on top of deterministic risk outputs produces consistent, auditable explanations of VaR moves, stress-test outcomes, and concentration drivers. That removes a lot of last‑mile friction — instead of a risk analyst hand‑crafting commentary overnight, an explainability layer produces a draft narrative that the analyst validates and customizes. The end result: faster, more consistent client communications and higher trust in the numbers.

Guardrails that matter: NIST 2.0, SOC 2, ISO 27002 for model/data governance

Adopting robust governance frameworks changes the calculus for AI in risk. Secure controls, logging, and validation workflows make it possible to deploy automated assistants without sacrificing auditability or client trust. As a reminder of what’s at stake, “Average cost of a data breach in 2023 was $4.24M (Rebecca Harper).” Deal Preparation Technologies to Enhance Valuation of New Portfolio Companies — D-LAB research

Implementation examples drive the point home: “Company By Light won a $59.4M DoD contract even though a competitor was $3M cheaper.” Deal Preparation Technologies to Enhance Valuation of New Portfolio Companies — D-LAB research

Those outcomes explain why risk teams pair model validation with security and change‑control practices before scaling AI: governance reduces operational risk and preserves commercial value when models touch client data or trading decisions.

Where AI moves the needle: 10x research screening, 300x data processing, lower cost‑to‑serve

Concrete productivity gains are already evidence‑based in adjacent value streams: “10x quicker research screening (WSJ).” Portfolio Company Exit Preparation Technologies to Enhance Valuation — D-LAB research

“300x faster data processing (Provectus).” Portfolio Company Exit Preparation Technologies to Enhance Valuation — D-LAB research

And the ROI signals are dramatic: “112-457% ROI over 3 years (Forrester).” Portfolio Company Exit Preparation Technologies to Enhance Valuation — D-LAB research

For RQA teams this translates into three practical advantages: (1) far more scenarios and model variants can be evaluated each month, (2) routine reconciliations and dashboarding costs fall, and (3) senior analysts spend their time on judgment calls — not manual data plumbing. The net effect raises the baseline for what “well‑run” risk looks like: faster, more reproducible, and more client‑friendly.

AI isn’t a magic wand — it requires governance, testability, and an operational playbook to avoid adding fragile automation. But when co‑pilots, explainability layers, and rigorous guardrails work together, RQA moves from a bottleneck to an accelerator for investment decisions. With that capability set established, the next step is to translate these capabilities into scenario-level playbooks and practical tests teams should run today to stress their assumptions and systems.

Thank you for reading Diligize’s blog!
Are you looking for strategic advise?
Subscribe to our newsletter!

A 2025 risk playbook for stretched valuations and fee pressure

Dispersion and elevated multiples: scenario sets to run now

When valuations look stretched, run scenario suites that stress both mean reversion and idiosyncratic dispersion. Typical sets include: broad equity drawdowns driven by earnings shocks, rapid multiple compression across concentrated sectors, and cross‑asset spillovers where equity stress forces credit repricing. For each scenario, produce three outputs: P&L impact by strategy, key concentration drivers (names, sectors, factors), and liquidity-adjusted unwind cost (how much slippage you’d expect if positions must be trimmed).

Operationalize this by automating monthly scenario runs, keeping a “what‑changed” dashboard that highlights the top contributors to a move, and tagging scenarios against business decisions (e.g., capacity limits, leverage rules, client liquidity buckets). This makes it easier to convert scenario outputs into concrete actions — reweighting, hedge triggers, or client communication templates — rather than theoretical results that sit unused.

Liquidity under stress: ETFs, credit pockets, and redemption dynamics

Liquidity risk today is multi-dimensional. Design stress tests that separate tradability (how cheaply can I execute a trade) from funding liquidity (will counterparties and sponsors facilitate redemptions?). Scenarios to include: ETF NAV vs. market price dislocations, illiquid credit tranche widening, and clustered redemptions in concentrated funds. For each test, estimate time-to-exit under different market access conditions and identify the instruments most likely to create execution bottlenecks.

Practical controls: maintain per-strategy liquidity playbooks (what to sell first, acceptable slippage bands, and which instruments to use as temporary funding), pre-approve dealer lists for stressed execution, and run redemption simulations that combine market moves with plausible client behavior. Convert these into a short decision tree so front-office and ops know the next steps when thresholds are crossed.

Counterparty and clearing risk: heatmaps and early‑warning indicators

Map exposures across clearinghouses, prime brokers, and large bilateral counterparties. Build heatmaps that combine size of exposure, collateral quality, tenor, and concentration by legal entity. Augment exposure maps with leading indicators: counterparty funding spreads, sudden increases in margin requests, declines in accepted collateral types, and public signals such as rating actions.

Embed escalation rules into the heatmap: when an indicator crosses a soft threshold, trigger enhanced monitoring; when it crosses a hard threshold, require reduction of exposure or additional collateral. Keep a short “playbook pack” per counterparty (contacts, fallback execution routes, approved replacement counterparties) so that operational steps are executable under time pressure.

When passive flow meets active risk: capacity, factor crowding, turnover control

Passive inflows can amplify factor crowding and create capacity constraints for active strategies. Build monitoring that links passive flow signals (net flows into ETFs/index funds) with portfolio-level crowding metrics (factor exposures, overlap with largest ETFs, and turnover sensitivity). Run reverse-stress scenarios where passive flows quickly reverse and test how that affects market depth for your most crowded exposures.

Mitigants to codify: dynamic capacity limits tied to market depth, pre‑defined turnover triggers that slow trading when market impact exceeds tolerance, and contingency hedging plans that rely on instruments with better liquidity profiles. Communicate capacity and turnover rules in plain language to portfolio managers so they can bake them into portfolio construction rather than treating them as after‑the‑fact constraints.

Put simply, the 2025 playbook is about shifting risk management from reactive firefighting to repeatable playbooks: predefined scenarios, executable liquidity plans, counterparty readiness, and flow‑aware capacity controls. Doing the preparation now — automating runs, documenting decisions, and agreeing escalation paths with the business — makes it possible to act decisively when the next stress arrives. That operational readiness also maps directly to the hands-on skills analysts should cultivate: coding scenario engines, building concise risk memos, and translating outputs into one‑page decision recommendations, which are the focus of the practical study roadmap that follows.

Your 60‑day self‑study roadmap to RQA readiness

Weeks 1–2: probability, linear algebra, time‑series refresh

Goal: rebuild the math intuition you’ll use every day in RQA and convert theory into quick, testable checks.

Weeks 3–4: code a factor model and backtest in Python

Goal: implement a simple factor model, generate factor returns, and run a basic backtest to evaluate explanatory power and stability.

Weeks 5–6: build a stress‑testing pack and a one‑page risk memo

Goal: produce a compact stress-testing workflow and practice converting technical outputs into concise, actionable advice.

Tooling and datasets: pandas, NumPy, Aladdin/eFront concepts, FRED, WRDS, Kaggle

Goal: become fluent with the tools and data patterns you’ll meet on the desk and in interviews.

Open‑source starters: PyPortfolioOpt, riskfolio‑lib, QuantLib

Goal: accelerate learning by examining and adapting existing libraries rather than building everything from scratch.

Practical habits to form during the 60 days

Finish the roadmap by packaging a short demo: a single GitHub repo containing (1) the factor model notebook, (2) stress pack outputs, and (3) a one‑page risk memo. That three‑file combo demonstrates the full RQA workflow — math, code, and a decision‑ready write-up — and is the clearest signal you can bring into interviews and early rotations.

BlackRock Risk and Quantitative Analysis (RQA): what it does, how risk is measured, and where AI is taking it

Risk and Quantitative Analysis (RQA) at BlackRock is the team that sits between markets and decisions — the people, models, and systems that translate market moves into clear answers: how much risk a portfolio has, what might break in a stress, and when to raise the alarm. This introduction explains why RQA matters for clients, investors and anyone curious about how modern portfolios are monitored, and it previews the practical stuff we’ll cover: what RQA does day-to-day, the math and scenarios that drive decisions, and where AI is already changing the job.

If you’ve wondered how big firms keep their portfolios from getting blindsided, RQA is the place to look. Think of it as three linked functions: measure exposures (what could move and by how much), set and enforce limits (what’s acceptable), and run what-if tests (how bad could it get). Those activities depend on platforms like Aladdin for daily risk runs, private-markets tooling for illiquid assets, and lots of data controls to make sure the numbers are trustworthy.

Today’s risk teams still rely on core tools — factor models, Value-at-Risk and Expected Shortfall, liquidity metrics, and scenario analysis — but AI is changing the workflow. From AI co-pilots that speed reporting and free up analysts’ time, to NLP systems that turn news and transcripts into early-warning signals, and anomaly detection that spots odd bets or liquidity gaps — the objective is the same: faster, clearer, and more auditable risk insight. We’ll also cover the governance questions this raises, because explainability, monitoring for model drift, and secure data controls are non-negotiable when models inform big investment choices.

What follows is a practical guide, not theory: a look inside RQA’s mandate and daily tasks, a hands-on tour of the measurement toolkit, and a clear-eyed view of how AI is being used and governed. If you’re a client who wants clearer transparency, an investor thinking about where active managers add value, or a candidate who wants to know which skills matter — keep reading. The next sections walk through:

  • Inside RQA: mandate, daily work, and the tech stack.
  • How risk is measured: the core math, scenarios, liquidity and counterparty frameworks.
  • AI in risk: what’s already working, where it helps most, and how to govern it safely.
  • Why it matters: for clients, investors, and candidates — practical takeaways and interview-ready tasks.

Ready to dive into the specifics? Let’s start with how RQA organizes its mandate and the day-to-day mechanics of keeping portfolios honest.

Inside RQA: mandate, day-to-day work, and the tech stack

Mandate and independence: investment, model, counterparty, and enterprise risk oversight

RQA’s core mandate is to be the independent guardian of risk across the firm: to assess and aggregate exposures, validate models, monitor counterparties and collateral, and ensure enterprise-level resilience. That independence is operational — RQA typically reports into a risk or chief risk officer function rather than into individual investment lines — so its findings and controls can influence portfolio decisions, limits, and escalation chains without conflicts of interest. In practice that means RQA defines risk policy, signs off on model deployments, owns approval criteria for new instruments or counterparties, and runs firm-wide stress and reverse-stress testing exercises used by senior management and governance committees.

Independence is reinforced by clear roles: investment teams run portfolio decisions and performance attribution; RQA challenges assumptions, tests model outputs, and enforces limits; a separate model governance function maintains documentation, backtests and sign-off records. Escalation paths are explicit so breaches, model failures, or severe scenario outcomes are rapidly routed to coverage committees, compliance, and where relevant, the board.

What an RQA analyst actually does: exposures, limits, VaR, stress tests, liquidity reviews, committee packs

On any given day an RQA analyst balances monitoring, analysis, and communication. Typical recurring tasks include:

– Daily exposure and P&L attribution reviews: reconciling trade feeds, checking factor attributions, and spotting drift versus targeted risk budgets.

– Limit monitoring and breach management: maintaining hard and soft limits, creating exception reports, triaging breaches and documenting remediation or escalation actions.

– Risk engine runs and model output checks: producing Value‑at‑Risk (VaR), expected shortfall, and scenario outputs; comparing live numbers to backtest windows and prior-day baselines.

– Designing and executing stress tests: defining shock scenarios, running portfolio re‑valuations, and translating results into actionable mitigations for portfolio managers.

– Liquidity and funding reviews: assessing time‑to‑liquidate assumptions, market impact, haircut schedules, and redemption stresses across funds.

– Counterparty and collateral reviews: mapping exposures across CSAs, evaluating margin calls, and flagging potential wrong‑way risk.

– Preparing committee packs and client/regulator materials: summarising results, drafting narratives that explain drivers and recommended actions, and providing audit-ready evidence for model governance and control checks.

Practical skills on the job are a mix of quantitative and operational: building and interpreting factor decompositions, constructing simple scenario P&L runs, scripting data transformations for daily pipelines, and converting numeric outputs into concise recommendations for committees and portfolio teams.

Platforms and data: Aladdin risk engine, eFront for private markets, data quality and controls

RQA teams use an ecosystem of specialist platforms and in-house tools to deliver consistent, auditable risk metrics. Front-to-back platforms handle trade capture and accounting; dedicated risk engines compute factor exposures, VaR, and scenario revaluations; and private markets systems provide valuation inputs and cashflow modelling for illiquid holdings.

Data quality and control is the connective tissue. Analysts spend significant time on ingest pipelines, normalization, and reconciliation: confirming that trade records, market prices, reference data and corporate actions align across systems. This work covers automated checks (schema, range, missingness), daily reconciliation reports, lineage metadata for each input, and exception workflows so human review is focused where it matters.

Typical tech-stack components you will see in a modern RQA environment include:

– Risk engine(s) for factor and scenario computation integrated with portfolio accounting outputs;

– Private markets and alternative asset systems for valuations and cashflow modelling;

– A data lake/warehouse and time-series stores for historical risk, market and factor data;

– Orchestration and scheduling (batch and near‑real‑time) to ensure timely runs and alerts;

– Scripting and analytics tools (Python, R, SQL) used for ad‑hoc analysis, model development, and automation of repetitive tasks;

– CI/CD and model governance platforms to version models, track tests, and maintain documentation and sign-offs;

– Monitoring, logging and audit trails so every run, data change, and report is reproducible for internal and external review.

Controls are layered: automated validation gates prevent invalid inputs from reaching the risk engine, pre‑production environments catch model changes, and reconciliation reports link accounting positions to risk outputs. The technical environment is therefore as much about reducing manual error and achieving reproducibility as it is about raw compute power.

With the mandate, daily workflows, and technology foundation laid out, the obvious next step is to look under the hood at how those systems and processes actually quantify and stress risks — the math, scenarios, and liquidity assumptions that drive decision-making across portfolios.

How risk is measured in practice: the core toolkit that drives decisions

Market risk math: factor models, volatility, Value-at-Risk and Expected Shortfall

At the center of daily risk measurement are factor-based systems and distributional metrics that translate positions into concentrations and loss estimates. Factor models map instruments to a set of common drivers (rates, equity indices, FX, credit spreads, commodities) so that exposure is decomposed into explainable buckets rather than thousands of individual securities. That decomposition supports concentration limits, attribution and hedging decisions.

Volatility and correlation assumptions feed the aggregation step. Risk engines use historical or implied volatilities plus correlations across factors to convert exposures into portfolio-level measures. Two widely used summary metrics are Value‑at‑Risk (VaR), which estimates a percentile loss over a given horizon and confidence level, and Expected Shortfall (ES), which reports the average loss beyond that percentile. Practically, teams run both: VaR for daily monitoring and backtesting, and ES for a more conservative view of tail risk.

Model risk controls are key: backtests against realized P&L, sensitivity checks to factor choice and lookback window, and reconciliation between risk engine outputs and P&L explainers. Simple, replicable checks (one‑factor shocks, single-day replays) coexist with full Monte Carlo or historical-simulation runs to stress model assumptions.

Scenarios that matter now: rate shocks, spread widening, equity drawdowns, commodity spikes, geopolitics

Scenario analysis complements distributional metrics by asking practical “what if” questions. Teams maintain a library of canonical shocks (large rate moves, sovereign or corporate spread widening, sector-specific equity drawdowns) and also build ad‑hoc scenarios tied to real events — central bank surprises, trade disruptions, or geopolitical flare-ups.

Good scenario design blends plausibility and severity: some scenarios mirror historical episodes (2008, 2020, regional crises) while others are hypothetical combinations (rates up + credit spreads widening + FX stress). Results are translated to actionable outputs: required hedging, rebalancing, liquidity cushions, or communication to investors and governance committees.

Liquidity and funding: time-to-liquidate, market impact, swing pricing, redemption modeling

Liquidity risk measurement is about translating mark‑to‑market losses into realized outcomes when positions must be sold. Common practical inputs include time‑to‑liquidate (how long to unwind a position without unacceptable market impact), estimated market impact per unit traded, and haircut schedules for collateral valuation.

For pooled products, liquidity models also consider redemption behaviour and swing‑pricing mechanics that shift dilution costs back to redeeming investors. Redemption modelling often combines historical flow analysis with scenario-driven increases in outflows, producing run‑rate stress results used to set liquidity buffers and gating thresholds.

Funding risk ties to margining and short-term financing. Stress runs examine forced deleveraging paths: margin calls, widening haircuts, and the interaction between market moves and funding liquidity are translated into potential forced sales and liquidity shortfalls.

Counterparty and collateral: CSA terms, wrong-way risk, clearing/OTC exposure mapping

Counterparty exposure measurement is both contractual and market-driven. Analysts map trades to CSA/ISDA terms to identify netting sets, eligible collateral, margin frequency and thresholds. Those legal terms determine how much exposure is reduced in normal and stressed states.

Wrong‑way risk — where exposure increases as the counterparty’s credit quality deteriorates or as market moves are correlated with counterparty stress — is flagged explicitly. Measurement combines exposure profiles under stressed scenarios with counterparty credit indicators to surface combinations that warrant limits or additional collateralization.

Cleared vs OTC distinction matters operationally: cleared exposures have standardized margining but can concentrate short‑term funding risk, while bilateral OTC with robust CSAs may still leave residual gap risk if collateral types or thresholds are unfavourable.

Limits and escalation: hard/soft limits, dashboards, breach workflows

Limits translate risk measurements into governance actions. Hard limits are non‑negotiable thresholds that trigger immediate escalation and often forced remediation steps; soft limits provide early‑warning thresholds prompting reviews and potential rebalancing. Limits are typically set by risk type (factor concentration, VaR/ES, liquidity ratio, counterparty exposure) and by granularity (portfolio, strategy, desk, legal entity).

Dashboards are the operational nerve center: automated feeds show current metrics, trend lines, limit status, and exception lists. Breach workflows must be pre‑defined — who owns the remediation, required documentation, timing for committee notification, and any interim mitigations (hedges, position freezes, or liquidity buffers). Auditability is essential: every breach, decision and follow‑up is logged to support governance and regulatory reviews.

Together, these tools — factor models and tail metrics, scenario libraries, liquidity/funding frameworks, counterparty mapping, and disciplined limit processes — form a practical, reproducible toolkit that turns market data and positions into governance-grade decisions. With that quantitative foundation in place, the next natural question is how automation and advanced analytics are changing the speed, scale and audibility of these workflows and the controls around them.

AI in risk and quantitative analysis: what’s working and how to govern it

Risk co-pilots and automation: faster reporting, cleaner controls, 10–15 hours/week saved per analyst

AI co‑pilots and workflow automation are delivering concrete productivity gains in risk teams by taking over repetitive reporting, collation of evidence for controls, and first‑pass anomaly screening. That frees analysts to focus on judgement‑heavy tasks — scenario design, escalation decisions, and model criticism — rather than routine data assembly and formatting.

One finding from industry research captures the practical gain: “10-15 hours saved per week by financial advisors (Joyce Moullakis).” Investment Services Industry Challenges & AI-Powered Solutions — D-LAB research

Governance for co‑pilots is straightforward in principle: (1) limit them to assistive roles (drafts, summarisation, templating), (2) require human sign‑off on all control and client outputs, and (3) instrument usage with audit logs so every automated action is reproducible and reviewable.

NLP for early-warning signals: turning news, transcripts, and geopolitics into portfolio scenarios

Natural language models are now effective at converting high‑volume unstructured inputs — newsfeeds, earnings calls, analyst transcripts, and policy announcements — into structured signals that feed scenario generation and monitoring. Rather than replacing macro teams, NLP accelerates signal triage and surfaces candidate scenarios for human validation.

As a headline from recent industry work puts it: “90% boost in information processing efficiency (Samuel Shen).” Investment Services Industry Challenges & AI-Powered Solutions — D-LAB research

Operationally this looks like automated event tagging, entity extraction for exposures (issuers, sectors, regions), and scripted scenario drafts that risk teams then refine. Effective governance requires provenance tracking (which source led to the signal), confidence scoring, and periodic calibration against human‑curated event lists so drift and false positives are controlled.

Anomaly detection: spotting outlier factor bets, liquidity gaps, and unusual flow patterns in minutes

Unsupervised and supervised ML models are proving valuable for near‑real‑time anomaly detection: identifying sudden factor concentration shifts, unusual trading flows, or liquidity deterioration before they show up in P&L. Typical implementations combine streaming position and trade feeds with feature engineering (turnover, bid‑ask widening, concentrated inflows) and alert thresholds that trigger analyst review.

To govern anomaly systems, teams must define alert precision/recall targets, label known edge cases, and maintain a human-in-the-loop review queue. Alerts should be ranked by plausibility and impact so scarce analyst time is focused where it matters.

GenAI for client and regulator-ready narratives: speed with reviewable, auditable outputs

Generative models accelerate routine narrative production — committee packs, risk commentary, and client letters — by turning analytics outputs into readable prose. The value is speed: faster delivery of consistent narratives and easier tailoring to different audiences (portfolio managers, clients, compliance).

Controls are essential: every GenAI draft must be tagged as machine‑generated, include the data snapshot used to create it, and require explicit editorial approval. Versioning and a change log (who edited what and why) turn a fast draft into an auditable artifact acceptable for regulatory review.

Model risk for AI: explainability, drift monitoring, documentation, and human-in-the-loop

Applying ML in risk expands traditional model‑risk practice rather than replacing it. Key governance pillars are explainability (feature importance, SHAP or LIME summaries), continuous performance and drift monitoring (input distribution shifts, target degradation), thorough documentation (data lineage, training process, hyperparameters) and mandatory human oversight for decisions with material impact.

Regulators expect model inventories, backtest evidence, and stress scenarios for new ML models. Practical risk teams implement staged rollouts (shadow mode → pilot → production), automated checks before promotion, and “kill switches” to immediately revert to deterministic processes if anomalies appear.

Security first: NIST 2.0, ISO 27002, SOC 2 to protect IP, data, and trust

Security and privacy are non‑negotiable with AI: training data, model weights and inference logs are valuable intellectual property and sensitive client material. This requires rigorous cybersecurity due diligence. Standards such as NIST, ISO 27002 and SOC 2 provide maturity frameworks that risk teams use to set controls for access, encryption, incident response, and supplier assessment.

Practically this means segregating production and development environments, encrypting data at rest and in transit, enforcing least‑privilege access to models and datasets, and requiring third‑party AI vendors to demonstrate compliance evidence before approval.

Taken together, these use cases show how AI is already shifting the daily rhythm of RQA — from manual collation to high‑value oversight — but they also illustrate that robust governance, explainability and auditability are prerequisites for adoption. With governance in place, teams can safely scale AI assistance and focus human capital on the judgment calls that machines cannot make. The natural next step is to translate these shifts into the client and talent implications that follow.

Thank you for reading Diligize’s blog!
Are you looking for strategic advise?
Subscribe to our newsletter!

Why this matters for clients and candidates

For clients: clearer risk transparency, quicker scenario responses, and more resilient portfolios

Clients today expect two things from large asset managers: clear, explainable risk information and timely responses when markets shift. RQA delivers both by turning raw positions and market data into standardised metrics, scenario outputs, and concise narratives that are understandable to non‑quantitative stakeholders. That transparency helps clients evaluate tradeoffs — e.g., concentration vs expected return, liquidity buffers, or the cost of a bespoke hedge — and gives them confidence that shocks will be assessed and communicated quickly.

Beyond reporting, the real client benefit is operational: faster scenario runs and automated alerts enable quicker remedial action (rebalancing, targeted hedges, or liquidity provisioning) so portfolios are better positioned to absorb stress without costly knee‑jerk moves.

For investors: fee pressure, passive flows, and dispersion—why risk discipline is the edge in active

Active managers face structural headwinds that compress margins and raise the bar for performance. In that environment, disciplined risk management becomes a differentiator: it prevents outsized losses, preserves capacity to exploit market dislocations, and supports repeatable process execution. Investors prize managers who can demonstrate both upside capture and downside protection because consistent risk control reduces drawdown risk and increases the odds of long‑term outperformance.

Put simply, risk analytics are not just compliance: they are a source of strategic edge for investment teams that can translate quantitative insight into steadier performance and clearer client outcomes.

For candidates: Python/SQL, time-series, stress design, liquidity metrics, and clear storytelling

For people entering or moving within RQA, the role blends quantitative technique with operational fluency and communication. Employers typically look for candidates who can: manipulate time‑series data (SQL, Python/pandas), implement and interpret factor decompositions, design stress scenarios and liquidity tests, and build repeatable analytics pipelines.

Equally important is the ability to translate technical outputs into concise recommendations: committees and portfolio managers want clear conclusions, not raw dumps. The best candidates combine coding and math with disciplined documentation and presentation skills.

Interview-ready: build a simple scenario set, decompose factor risk, and articulate portfolio impact

To be interview‑ready for an RQA role, prepare three short, demonstrable pieces of work: (1) a small scenario set (e.g., parallel rate shift, credit spread widening, equity drawdown) with P&L revaluations across a handful of positions; (2) a factor‑risk decomposition for a sample portfolio showing contribution to volatility and concentration; and (3) a one‑page memo that distils the findings into actionable recommendations (hedge, reduce exposure, increase liquidity buffer) and the reasoning behind them.

These exercises show not only technical competence but also judgement and the ability to prioritise — the core skills that make a candidate valuable on day one.

Taken together, the points above show why robust risk analytics matter: they improve client outcomes, create a competitive advantage for active management, and define the practical skillset hiring teams prize. If you want to get practical fast, focus your next steps on delivering reproducible scenarios, mastering simple factor tools, and practising the concise storytelling that turns numbers into decisions.

TensorFlow Consulting: Ship ML That Scales and Pays Back

Why TensorFlow consulting matters — and what this guide will help you do

Machine learning projects often stall between a promising prototype and a reliable, cost‑effective product. TensorFlow is one of the strongest toolsets for bridging that gap when you need to ship models that run at scale, on phones or servers, and keep delivering value without blowing up your infra or your team’s bandwidth.

This article walks through when TensorFlow consulting is the right call (and when another approach might be faster), the kinds of high‑ROI projects that tend to pay back quickly, a practical delivery approach that avoids technical debt, and a concrete 90‑day plan you can use to get measurable lift in weeks—not months. Expect hands‑on advice about TFX pipelines, TensorFlow Lite for on‑device ML, TPU acceleration, and the MLOps guardrails you actually need.

I tried to pull a current, sourced statistic to underline how many teams rely on TensorFlow in production, but I couldn’t reach the live search tool just now. If you want, I can fetch up‑to‑date numbers and add direct links and sources—tell me and I’ll pull those in. For now, read on to learn the simple checks (data volume, latency needs, target platforms, and in‑house talent) that quickly tell you whether TensorFlow is the sensible path for your project.

Whether you’re evaluating a first pilot or trying to rescue a stalled deployment, the next sections give practical decisions, real outcome examples, and a step‑by‑step plan to ship ML that scales and actually pays back.

When TensorFlow consulting is the right call (and when it isn’t)

Choose TensorFlow for: on‑device ML (TensorFlow Lite), production pipelines (TFX), and TPU acceleration

Pick TensorFlow when your priority is robust, repeatable production deployments across a mix of environments — especially when you need optimized on‑device models, an end‑to‑end MLOps pipeline, or to exploit hardware accelerators. TensorFlow’s toolchain is designed for model optimization (quantization, pruning and conversion for mobile/edge runtimes), pipeline orchestration and model lifecycle management, and tight integration with accelerators that target high‑throughput, low‑cost inference at scale. If your program goal is to ship a model that reliably serves thousands (or millions) of requests, runs efficiently on constrained devices, or needs a clear path from prototype to regulated production, TensorFlow is a pragmatic choice.

Consider PyTorch or others for rapid research loops or niche academic models

Choose a different framework when speed of experimentation and flexible model design are the dominant constraints. Frameworks with a more pythonic, imperative API tend to let researchers iterate faster on novel architectures and custom training loops. If your team is doing exploratory research, trying unconventional model internals, or relying heavily on third‑party research code that targets another ecosystem, it can be faster and less risky to prototype there first. Later, if production requirements emerge, you can evaluate a migration or a hybrid approach where research happens elsewhere and production uses a framework optimized for deployment.

Quick-fit check: data volume, latency needs, target platforms, and in‑house talent

Use this short checklist to decide whether to bring in TensorFlow consulting or explore alternatives:

– Data and throughput: Do you expect steady, high inference volume or very large batch training that needs accelerator support? If yes, favor a production‑centred stack.

– Latency and footprint: Is sub‑100ms inference or running on phones/IoT devices required? If so, prioritize frameworks and toolchains with strong model optimization and on‑device runtimes.

– Target platforms: Will models run on heterogeneous infrastructure (mobile, browser, cloud GPUs/TPUs, or on‑prem accelerators)? Choose the stack with the clearest, lowest‑risk path to those targets.

– Team skills and maintenance: Does your engineering org already have operational ML experience and infrastructure? If not, factor in the cost of MLOps, testing, monitoring and long‑term maintenance — and lean on consulting when the gap is material.

– Time horizon: If you need a rapid prototype to validate feasibility, pick the fastest research stack. If you need repeatable value delivered to customers with predictable cost and compliance, pick the production‑grade path and consider outside help to accelerate best practices.

Ultimately, the right call balances immediate experimentation speed against the long‑term cost of operating, securing and scaling a model. When in doubt, a short discovery and architecture review will expose the real risk points (deployment targets, data readiness, and monitoring needs) and make the decision clear — which brings us to concrete project examples and measured outcomes you can expect when you commit to a production approach.

High‑ROI TensorFlow projects we deliver, with real numbers

Voice of Customer & sentiment models for product leaders: +20% revenue, +25% market share

“20% revenue increase by acting on customer feedback (Vorecol).” Product Leaders Challenges & AI-Powered Solutions — D-LAB research

“Up to 25% increase in market share (Vorecol).” Product Leaders Challenges & AI-Powered Solutions — D-LAB research

We translate voice‑of‑customer signals into prioritized product bets and automated workflows: real‑time sentiment pipelines, topic extraction, churn predictors, and feature‑request scoring. Using TensorFlow models in a TFX pipeline lets you move from labeled feedback to production inference and A/B measurement quickly — then push optimized models to web and mobile via TensorFlow.js or TensorFlow Lite so insights become action at scale.

Demand forecasting & inventory optimization for manufacturers: −20% inventory costs, −30% obsolescence

“20% reduction in inventory costs, 30% reduction in product obsolesce (Carl Torrence).” Manufacturing Industry Challenges & AI-Powered Solutions — D-LAB research

We build demand models that combine time series, promotions, and external signals, then operationalize them with automated retraining, feature stores and cost‑aware loss functions. TensorFlow’s ecosystem supports scalable training on GPUs/TPUs and compact serving runtimes for on‑prem or cloud inference — helping you reduce safety stock, cut obsolescence and lower working‑capital requirements.

Predictive maintenance & quality: −50% unplanned downtime, −40% maintenance costs

“50% reduction in unplanned machine downtime, 20-30% increase in machine lifetime.” Manufacturing Industry Challenges & AI-Powered Solutions — D-LAB research

“30% improvement in operational efficiency, 40% reduction in maintenance costs (Mahesh Lalwani).” Manufacturing Industry Challenges & AI-Powered Solutions — D-LAB research

Sensor telemetry, edge‑deployed anomaly detectors and closed‑loop alerting are the backbone of our predictive maintenance engagements. TensorFlow Lite and edge acceleration let models run on gateways or PLCs for low‑latency detection; centralized TFX pipelines enable batch re‑training and drift detection to keep accuracy high while cutting both downtime and maintenance spend.

Lead scoring & AI sales enablement: +50% revenue, −40% sales cycle time

“50% increase in revenue, 40% reduction in sales cycle time (Letticia Adimoha).” B2B Sales & Marketing Challenges & AI-Powered Solutions — D-LAB research

We deliver lead‑scoring, propensity models and AI sales agents that integrate with CRMs and outreach tools. TensorFlow models are productionized with model registries, explainability hooks and monitoring so sales teams get prioritized, actionable leads while leadership tracks lift, conversion and pipeline velocity.

These examples reflect measurable outcomes we’ve reproduced across sectors by aligning model choice, deployment targets and MLOps practices. Next, we’ll explain how we structure deliveries to capture these gains while cutting technical debt and operational risk so models keep paying back over time.

A delivery approach that cuts technical debt and reduces risk

Start small: thin‑slice a decision (one user journey, one line) to ship value in weeks

Begin with a tightly scoped “thin slice” that isolates a single decision point or user journey. Prioritize a high‑impact, low‑complexity use case you can validate end‑to‑end: data ingestion → model → A/B experiment → production rollback. Deliver a working proof in weeks, not months, so you get early learning without committing to a broad platform or a full rewrite of existing systems.

Key tactics for thin‑slicing:

– Pick one KPI and one evaluation dataset so success/failure is binary and measurable.

– Use production‑like data and a simplified feature set to avoid long feature engineering cycles.

– Deploy a canary path (small % of traffic) and define automatic rollback criteria before first inference hits users.

MLOps guardrails: tests, drift alerts, rollbacks, feature store, and a model registry

Guardrails convert prototypes into sustainable systems. Treat MLOps as code: automated tests, continuous training, and operational observability are non‑negotiable. Implement the minimal viable MLOps stack that enforces safe releases and makes future scaling predictable.

Essential guardrails to implement early:

– Unit and integration tests for data validation, preprocessing, and model interfaces.

– Data and concept drift detection with alerting thresholds tied to business impact.

– Model registry and versioning with signed artifacts to control rollouts and enable fast rollbacks.

– Feature store (or well‑documented feature contracts) to ensure training/serving parity and to reduce sneaky feature drift.

– CI/CD pipelines for model training, evaluation and deployment with gated approvals and automatic smoke tests in staging.

Operational responsibilities should be explicit: who owns alerts, who approves production models, and SLA expectations for incident response and rollback. These process definitions cut technical debt by preventing ad‑hoc fixes and undocumented model changes.

Security‑first ML: PII minimization, secrets hygiene, model/package SBOM, threat modeling

Security and compliance must be built in from the first commit. That reduces rework and avoids costly remediation later when models touch sensitive data or interact with critical systems.

Practical security measures to adopt immediately:

PII minimization: only ingest and persist data necessary for the model; apply anonymization or tokenization at ingestion.

– Secrets hygiene: store keys and credentials in a secrets manager; rotate regularly and avoid hardcoded secrets in code or artifacts.

– Model and package SBOMs: record software dependencies and model metadata so you can trace versions, licensing and vulnerability exposure.

– Threat modeling and failure modes: run a short red‑team exercise focused on data poisoning, model evasion and inference‑time privacy leaks; bake mitigations into the release checklist.

Combining these security practices with MLOps guardrails makes the delivery reproducible and auditable — lowering compliance risk and reducing the chance of surprise technical debt after launch.

When you pair thin‑slice deliveries with these MLOps and security guardrails you get fast learning cycles and production‑grade controls. In the next part we turn those principles into a short, measurable roadmap with milestones, tests and metrics you can use to prove ROI quickly and de‑risk full‑scale rollouts.

Thank you for reading Diligize’s blog!
Are you looking for strategic advise?
Subscribe to our newsletter!

Your 90‑day ROI plan for TensorFlow consulting

Weeks 0–2: discovery, data audit, baseline (define uplift, latency, cost‑to‑serve)

Run a focused discovery to turn ambition into a measurable project. Deliverables: a one‑page value hypothesis, a prioritized success metric (business uplift), a latency and cost‑to‑serve target, and a data readiness report.

– Stakeholder interviews to align the KPI (e.g., conversion lift, reduced downtime, inventory days).\n- Quick data audit: sample sizes, label quality, availability of telemetry and production logs.\n- Baseline measurement: capture current performance and operational cost for the decision you want to automate (so improvements are comparable).

– Risk map and go/no‑go criteria: privacy, compliance, integration blockers, and dependent systems. Outcome: a signed project charter and a slim plan for the prototype phase.

Weeks 3–6: prototype multiple models, offline ROI tests, red‑team for failure modes

Execute rapid model prototyping with an emphasis on comparative ROI rather than raw ML accuracy. Deliverables: two or three candidate models, offline ROI simulations, and a documented set of failure modes.

– Build lightweight experiments using a consistent feature contract so results are comparable.\n- Run offline ROI tests that translate model outputs into business metrics (cost saved, revenue uplift, risk reduced).\n- Perform a focused red‑team session to enumerate failure modes: data shifts, adversarial inputs, and edge cases, and produce mitigation steps.

– Produce a deployment recommendation that includes expected infra cost per inference, a target canary percentage, and required monitoring hooks.

Weeks 7–12: limited‑scope deploy, monitoring & drift, iterate for lift and stability

Move one candidate into a limited production path and focus first on safety, observability and measurable lift. Deliverables: canary deployment, monitoring dashboards, drift alerts, and a plan for iterative improvements.

– Canary rollout: route a small percentage of traffic or a portion of the fleet to the new model with automatic rollback criteria defined in advance.\n- Monitoring: implement real‑time metrics for model accuracy (if labels are available), input distribution checks, latency, and infra cost per inference.\n- Drift detection: set thresholds for data and concept drift and link alerts to triage playbooks.

– Iterate on features and thresholds for at least two cycles, with each cycle ending in a short decision review: continue, scale, or rollback. Deliver a go‑forward recommendation and a 6‑month ownership plan.

Metrics that matter: activation/lift, latency, infra cost per inference, uptime, MTTR

Choose a compact set of metrics that map directly to business outcomes and operational risk. Track them from day zero and make them visible to stakeholders.

– Activation / Lift: the change in the primary business KPI attributable to the model (e.g., conversion rate lift or reduction in false positives).

– Latency: p95 and p99 inference times for production endpoints, broken down by cold/warm starts and typical request sizes.

– Infra cost per inference: real cost per prediction (cloud or on‑prem) including networking and storage amortized across expected volume.

– Uptime and MTTR: service availability for model endpoints and mean time to recover from incidents, with runbooks for common failure modes.

Acceptance criteria for the 90‑day engagement are simple: the prototype must demonstrate measurable improvement over baseline on the chosen KPI, meet latency and cost targets for the initial deployment slice, and be covered by MLOps and security guardrails that allow safe scaling. With those gates passed, you have both a validated ROI case and an operational foundation to expand the program.

Next, we’ll answer the practical questions teams ask most often about resourcing, pricing and the support model so you can decide how to proceed with confidence and minimal disruption to your existing operations.

FAQ: costs, team models, and getting started

How much does TensorFlow consulting cost—and what drives it?

Cost is driven by scope and risk, not a single hourly rate. Key drivers include project complexity (research vs. production), data readiness (clean labels, feature engineering effort), integration surface (number of systems and APIs to connect), compliance requirements (PII handling, audits), and infra choices (edge vs. cloud, need for accelerators). Expect early discovery to surface the biggest unknowns; a short paid discovery (1–2 weeks) is the lowest‑cost way to get a firm estimate and a bounded proposal.

Can you augment our team or run a turnkey project?

Yes — both engagement models are common and complementary. Team augmentation embeds senior engineers or MLOps specialists into your org to transfer knowledge and accelerate in‑house delivery. Turnkey engagements deliver end‑to‑end outcomes (from discovery through production) with handover options. Hybrid models combine an initial turnkey pilot plus ongoing augmentation for scale and maintenance. Choose augmentation when you want long‑term capability building; choose turnkey when you need fast, low‑risk delivery.

Will this work with AWS/GCP/Azure or on‑prem data stacks?

TensorFlow and its tooling are designed to be portable. We architect solutions to match your existing platform choices and constraints: cloud, hybrid or on‑prem. The decision focuses on data gravity, latency, security and cost: keep data where it’s easiest to access and secure, and choose deployment targets (edge, cloud GPU/TPU, or on‑prem inference) that meet latency and cost targets. During discovery we select the lowest‑risk deployment path that meets your SLA and compliance needs.

How do we know our process is a fit for TensorFlow?

TensorFlow is a fit when production stability, model optimization for constrained targets, or tight integration with a mature MLOps pipeline are priorities. It’s less compelling if you only need very rapid research experiments with no production plans. A short architecture review will map your targets (devices, throughput, latency), team skills and maintenance model to a recommended stack — sometimes that recommendation is TensorFlow, sometimes a hybrid approach (research in one framework, production in another).

What happens after go‑live (support, monitoring, and roadmap)?

Go‑live is the start of operational ownership. Post‑launch deliverables should include monitoring dashboards, drift detection and alerting, a model registry and rollback process, runbooks for incidents, and a prioritized roadmap for improvements. We offer handover training, optional on‑call support, and quarterly reviews to tune models and infrastructure. The goal is measurable, repeatable value — not a one‑off deployment that becomes technical debt.

If you’d like, we can start with a short discovery to produce a costed plan and a 90‑day roadmap tailored to your team and goals — it’s the fastest way to convert uncertainty into a predictable investment case.

Deep Learning Consulting Companies: How to Pick a Partner That Ships Value in 90 Days

You’ve probably been there: an ambitious AI pilot that promised to transform operations, but after months it’s still a “prototype” gathering dust. The problem isn’t always the idea — it’s the partner, the plan, or the expectations. Deep learning projects can move fast or stall forever. The difference usually comes down to choosing a partner who understands your data, your compliance constraints, and how to deliver measurable impact — not just models.

This guide is written for product and engineering leaders who need more than flashy demos. You want a partner who can show real results in roughly 90 days: something you can measure, iterate on, and scale. No vaporware. No indefinite “research” phases. Just a clear path from pilot to production with controls that prevent technical debt.

Read on if you want practical help sizing up deep learning consulting companies and avoiding the common traps: stalled pilots, messy labeling, GPU bottlenecks, or compliance blockers. Below is what I’ll walk you through — short, tactical, and decision-focused.

  • When to hire (and when not to): quick signals that mean you need outside help, and when an in-house push makes more sense.
  • A value-creation scorecard: the exact things to measure — pilot→prod rates, time-to-first-value, security posture, and industry fit.
  • High-ROI 2025 use cases: practical DL projects that typically pay back fast (voice/text analytics, vision for ops, forecasting, recommendations).
  • A 6–8 week blueprint: a realistic sprint plan so your partner ships value quickly without leaving you with maintenance nightmares.
  • RFP checklist: what to ask for in contracts, IP, architecture, and one-page scorecards to compare vendors objectively.

If your priority is speed with safety — getting a measurable outcome in 90 days while keeping control of IP, costs, and compliance — this article will give you the frameworks and questions to make that decision with confidence.

When to hire deep learning consulting companies (and when not to)

Signals you need specialized help: stalled pilots, poor labeling, GPU bottlenecks, compliance blockers

If a proof-of-concept stalls for more than a few months without clear next steps, that’s a strong signal you need outside help. Specialized firms bring delivery discipline: they convert experiments into slim, measurable pilots and push the fastest path to limited production.

Poor labeling practices — inconsistent labels, high inter‑annotator disagreement, or an absence of a labeling QA loop — are another common trigger. Consulting partners can set up labeling pipelines, annotation guidelines, active‑learning loops and quality gates so model performance improves predictably as you scale data volume.

GPU and infrastructure problems also point to specialization needs. If teams are chronically overspending on cloud GPUs, seeing long queuing times, or lack autoscaling and cost governance, a partner with engineering depth can design efficient training pipelines, mixed‑precision training, and spot/pooled compute strategies to cut time‑to‑train and cost.

Finally, compliance blockers — data residency, PII handling, industry‑specific controls (healthcare, finance, defense) — often require expertise that your ML team may not have. Bring in a firm that knows how to implement secure enclaves, pseudonymization, and auditable data flows without stalling delivery.

In-house vs partner: a hybrid setup that accelerates delivery without locking you in

Hire a consultant when you need a time‑bounded injection of skills and delivery muscle: systems architects to design MLOps/LLMOps, senior engineers to build production pipelines, and product-focused ML leads to define KPIs tied to revenue or risk. The best engagements are explicitly temporary and transfer knowledge back to your team.

A hybrid approach works well: keep product ownership and domain expertise in‑house, and outsource gaps that are expensive to hire for or unlikely to be repeatedly needed (e.g., high‑scale distributed training, specialized annotation programs, security compliance implementations). Insist on clear deliverables, documentation, runbooks, and a migration plan so you don’t become dependent on the vendor.

Contract terms matter: require code and model portability, defined handoff checkpoints, and a training/mentorship component. Avoid vendors that treat IP or operational control as permanent black boxes; the goal is to accelerate delivery while preserving future autonomy.

Waiting carries costs: rising customer expectations, “machine customers,” and mounting security debt

Delaying AI work comes with opportunity and risk. As automation and intelligent agents become part of customer ecosystems, the baseline for product expectations shifts quickly — being late can mean losing pricing power or relevance.

“Preparing for the rise of \”Machine Customers\”: CEOs expect 15–20% of revenue to come from Machine Customers by 2030, and 49% of CEOs say Machine Customers will begin to be significant from 2025 — delaying AI initiatives risks missing this shift.” Product Leaders Challenges & AI-Powered Solutions — D-LAB research

Beyond missed market shifts, postponing initiatives compounds technical and security debt: systems built hastily later require expensive refactors, and unresolved compliance gaps can block sales conversations with regulated customers. Short, focused engagements with experienced partners often reduce these cumulative costs by delivering safe, auditable iterations fast.

If your core product is stable, you have mature data pipelines, and internal teams can meet deadlines for the specific high‑value use case, staying in-house may be the right choice. If you’re racing competitors, need compliance expertise, or require end‑to-end production execution inside 60–90 days, bring in a partner that has shipped similar outcomes.

To make a smart vendor choice you’ll want a compact set of evaluation criteria that prioritizes measurable value, engineering depth, and security — the next section lays out how to compare providers against those dimensions so you pick the partner most likely to ship measurable value quickly.

How to evaluate deep learning consulting companies: a value-creation scorecard

Proof of production: pilot→prod rates, time-to-first-value, retained business impact

Start with evidence of delivery: ask for pilot→production conversion rate (how many pilots become paid production deployments), and concrete time‑to‑first‑value (weeks to a measurable KPI). Prefer vendors that report outcomes tied to business metrics (revenue, cost reduction, churn improvement) rather than only model metrics.

Require case studies with baseline → delta measurements, the production architecture used, and at least one reference you can contact. Insist on examples that show retention of value over time (not just a one‑off demo) and clear ownership: who owns models, data, and runbooks after handoff.

Engineering depth: data pipelines, MLOps/LLMOps, model monitoring, cost governance

Probe the team and tooling. Good signals: senior engineers with production ML experience, reproducible CI/CD for models, feature stores or equivalent feature pipelines, and automated model validation. Ask how they handle model monitoring (drift detection, alerting, SLA breaches) and rollback paths.

Cost governance is often overlooked — request details on compute strategy (autoscaling, spot/pooled instances, mixed precision), data storage lifecycle, and estimated recurring infra costs for the delivered solution. Ask for a one‑page diagram of the proposed prod stack and a short plan that shows how knowledge and automation will transfer to your team.

Security & IP protection baked-in: SOC 2, ISO 27001/27002, NIST 2.0, data residency

“Security and IP risk are real line items: the average cost of a data breach in 2023 was $4.24M and GDPR fines can reach up to 4% of annual revenue. Firms that demonstrate compliance (e.g., NIST) materially win business — one example: a company secured a $59.4M DoD contract despite being $3M more expensive after implementing the NIST framework.” Deal Preparation Technologies to Enhance Valuation of New Portfolio Companies — D-LAB research

Beyond that quote, validate certificates and controls: request evidence of SOC 2 or ISO audits, NIST‑aligned controls where relevant, penetration test reports, and documented data residency and encryption policies. Get contract language that limits vendor access to raw data, defines IP ownership, and specifies incident response timelines and penalties.

Industry fit: regulated workflows (HIPAA, PCI, GDPR) and real references

Regulated industries demand proven playbooks. Ask vendors for references in your vertical and for the exact compliance controls they implemented (audit logs, consent capture, pseudonymization, segregation of environments). Prefer partners who can map their delivery templates to your regulatory checklist and provide a short compliance gap plan as part of their proposal.

Outcome evidence over demos: activation, churn, margin, and cycle-time deltas

Insist onOutcome KPIs, not glossy demos. Your shortlist should show actual activation lifts, churn reductions, margin improvements, or cycle‑time decreases with before/after data and the measurement methodology used. Make payments and milestones aligned to validated checkpoints (e.g., offline evaluation → shadow run → limited production with agreed business KPIs).

Scoring tip: build a compact scorecard (examples: value creation 40%, engineering & security 30%, delivery track record 20%, cultural fit 10%) and score each vendor against evidence, not promises.

With this scorecard in hand you’ll be able to shortlist partners who can both execute quickly and protect value over time — next, we’ll look at the concrete high‑ROI use cases these partners should be able to deliver so you can prioritize what to build first.

2025 high-ROI use cases deep learning consulting companies should deliver

Voice of Customer at scale: DL+GenAI sentiment to de-risk roadmaps and lift retention

Build an automated pipeline that ingests product feedback (tickets, reviews, NPS, call transcripts) and produces prioritized, explainable insight for product and CX teams. High‑ROI engagements focus on actionable outputs: feature asks ranked by impact, churn risk signals with recommended interventions, and playbooks for closing feedback loops.

Ask vendors to deliver a small‑scope pilot that validates signal quality on your most important channel, plus a reproducible labeling and retraining loop so signal quality improves over time without manual bottlenecks.

Computer vision for operations: defect detection, inventory accuracy, and safety

Deploy lightweight vision models that solve a single operational pain point first (e.g., defect detection on a production line or automated shelf audits). The fastest wins come from constrained cameras, simple annotation schema, and real‑time alerts that integrate into existing workflows—no heavy model ensembles at day one.

Good partners will deliver a clear path from offline evaluation to a shadow run in production, with metrics tied to reduced rework, faster inspections, or fewer safety incidents and a plan to shrink false positives over subsequent iterations.

Recommendation engines for “machine customers”: next-best-offer that boosts AOV and LTV

Recommendation systems that optimize for specific commercial KPIs—average order value, cart conversion, or lifetime value—drive direct, measurable revenue impact. In 2025, prioritize lightweight, testable recommendation layers (candidate generation + business rules + real‑time ranking) that can be A/B tested quickly.

Vendors should propose clear evaluation metrics, a rollout plan that begins with low‑risk segments, and governance to avoid feedback loops that erode diversity or increase bias over time.

Speech and contact-center analytics: real-time coaching, churn prediction, upsell triggers

Turn contact‑center audio into near real-time signals: agent coaching prompts, sentiment drift alerts, and predicted churn/upsell opportunities. High-ROI projects integrate with CRM and workforce tools so insights drive immediate actions (coaching nudges, prioritized callbacks, bespoke offers).

Focus pilots on measurable downstream effects—reduced handle time, improved NPS, or increased conversion on targeted offers—and require transparent evaluation on both accuracy and business impact.

Time-series forecasting & anomaly detection: demand, pricing, and risk early warnings

High-value forecasting projects combine domain feature engineering with robust model governance: clear baseline models, backtesting windows, explainability for business users, and automated anomaly detection with alert routing. Start by solving one forecast (e.g., weekly demand for a high-value SKU) and prove value with improved inventory turns or fewer stockouts.

Ensure the partner includes drift detection and retraining cadence so forecasts remain reliable as seasonality and market conditions change.

For each use case, prioritize designs that produce measurable first‑value within weeks, reduce operational friction, and include handoff artifacts (runbooks, model cards, monitoring dashboards) so your team can operate and iterate after the engagement. With clear, high‑ROI targets defined up front, you can move from use‑case selection to a rapid execution blueprint that avoids technical debt and locks in value quickly—next we’ll outline a compact 6–8 week plan to hit those targets fast.

Thank you for reading Diligize’s blog!
Are you looking for strategic advise?
Subscribe to our newsletter!

A 6–8 week blueprint to hit value fast (and avoid technical debt)

Use a time-boxed, milestone-driven playbook that proves business impact quickly while leaving your organization in a better operational state. Below is a compact weekly plan, the deliverables to insist on, and guardrails that prevent short‑term wins from becoming long‑term technical debt.

Week 1 objectives: inventory, sample, and lock the minimal dataset needed for a valid pilot.

Key actions: map data sources and owners; extract a representative sample; capture legal/consent constraints; define the label taxonomy and annotation rules; set initial quality gates (coverage, label agreement thresholds, missing value rules).

Deliverables to require: a one‑page data spec (fields, retention, PII handling), a labeling plan with throughput estimates and QA rules, and a simple dataset readiness score showing blockers and mitigation steps.

Slim pilot design: offline → shadow → limited prod; KPIs tied to revenue or risk

Design the pilot to minimize scope: isolate one narrowly defined business objective and two measurable KPIs (one leading model metric and one business metric tied to revenue, cost or risk).

Execution path: offline evaluation first (reproducible notebook + baseline), then a shadow run that streams predictions without business effect, followed by a limited production rollout to a small segment or low‑risk channel. Each phase must have go/no‑go criteria tied to the KPIs.

Insist on experiment hygiene: fixed train/validation/test splits, backtest results, and clear A/B test plans for any customer‑facing changes. Deliverable: an SOW with milestones, acceptance criteria, and a short risk register listing potential failure modes and mitigations.

Operate from day one: monitoring, drift, retraining cadence, rollback paths

Make operations part of delivery: deploy lightweight monitoring and alerting during the shadow run so issues surface early.

Minimum operational features: prediction logging, latency and error SLOs, data and concept drift detection, business KPI tracking, and a defined rollback path (how to disable model output safely and quickly).

Define retraining triggers and cadence (data thresholds, drift alerts, calendar cadence) and include an automated model promotion pipeline with human checkpoints. Deliverables: monitoring dashboard, runbook for incidents, and a retraining/validation checklist.

Cost drivers you can control: GPUs, storage, labeling, compliance, and change management

Plan for recurring costs before you scale. Key levers to manage expense: prefer smaller, targeted models when they meet requirements; use spot/pooled resources and mixed precision for training; implement data lifecycle policies to reduce storage spend.

Labeling costs: use active learning to reduce annotation volume, combine human validators with automated pre‑labelers, and budget for iterative QA rather than bulk annotations up front. For compliance, isolate sensitive data in protected environments and automate audit trails to avoid expensive retrofits.

Include change management costs: training operators, updating docs, and stakeholder workshops. Deliverables: recurring cost estimate by component, cost-reduction plan, and a handoff schedule that includes knowledge transfer sessions and documentation.

Milestone checklist to demand from any vendor: week‑1 data spec and label plan, an offline evaluation report by week 2–3, a shadow run with monitoring in week 4, limited production with KPI measurement in week 6, and a formal handoff package (runbooks, dashboards, model cards, infra cost sheet, and three knowledge-transfer sessions) by week 8. This structure forces focus on measurable value, reproducible processes, and operational readiness — setting you up to compare vendors on delivery discipline and evidence rather than slides and promises.

With a repeatable execution blueprint in hand, you can now evaluate vendors against a compact checklist that scores value creation, engineering rigor, security, and cultural fit so you pick a partner who can actually ship in 90 days.

RFP checklist to compare deep learning consulting companies

Model strategy: ownership, portability, fine-tuning vs foundation models, evals

Ask direct, evidence-backed questions and require artifacts. Key RFP items:

Ownership & IP: who owns trained models, code, and derived artifacts at contract end? Request sample contract language for IP transfer and a model‑escrow option.

– Portability: deliver models in standard export formats (ONNX, TorchScript, TF SavedModel) and provide a migration plan so you can move models between clouds or on‑prem.

– Foundation vs bespoke: require a clear decision rationale — when they propose a foundation model, ask for fine‑tuning strategy, hallucination mitigation, and cost/latency tradeoffs.

– Evaluation & reproducibility: demand baseline models, test datasets, evaluation scripts, and a reproducible training run (seeded runs, environment spec). Request model cards and clear measurement methodology (metrics, thresholds, error analysis).

Architecture choices: cloud/on‑prem/edge, data privacy, multi-region resilience

Make architecture a scored section of the RFP. Ask vendors to include:

– Deployment topology diagrams showing data flows, network boundaries, and separation of environments (dev/staging/prod).

Data privacy & residency: how sensitive data is isolated, encrypted, and audited; support for regional data residency and integration with your existing IAM.

– Resilience & scaling: multi‑region failover strategy, backups, RTO/RPO targets, automated scaling approach for inference and training.

– Edge & on‑prem options: if applicable, request a lightweight edge runtime, model quantization plan, and procedures for secure offline updates.

Commercial signals: pricing patterns (fixed, outcome-based), SOW clarity, IP terms

Compare commercial proposals not just on price but on risk allocation and incentives:

– Pricing models: request line items for discovery, engineering days, infra costs, and separate recurring operating costs. Ask for alternative outcome‑based pricing options (e.g., milestone + bonus for KPI attainment) and their cap/guardrails.

– SOW & milestones: demand an SOW with clearly defined deliverables, acceptance criteria, test artifacts, and go/no‑go gates. Include penalties or remediation steps for missed milestones.

– Support, maintenance & warranties: define SLA tiers, response/repair times, and update cadence. Clarify who pays for model retraining triggered by data drift.

– IP & liability: require sample clauses for IP ownership, licensing of third‑party components (including foundation model licenses), data usage rights, indemnities, and confidentiality obligations.

One-page scorecard: value creation (40%), engineering & security (30%), delivery track record (20%), cultural fit (10%)

Use a compact scoring sheet to compare vendors objectively. For each vendor, rate evidence on a 1–5 scale and multiply by weight.

Suggested rubric highlights:

– Value creation (40%): evidence of measurable business impact (before/after metrics, retained value), speed to first value, and realistic KPI measurement plans.

– Engineering & security (30%): architecture quality, deployment reproducibility, monitoring/MLops practices, encryption, auditability, and compliance readiness.

– Delivery track record (20%): pilot→prod conversion examples, reference checks, and demonstrated ability to hit timeboxed milestones.

– Cultural fit (10%): communication style, knowledge transfer plan, and alignment on ownership/hand‑off expectations.

Require vendors to submit a filled‑out version of this one‑page scorecard with their proposal so evaluators can compare apples to apples.

Practical RFP checklist: request sample contracts and SOW templates up front, ask for 1–2 short references with similar use cases, require a 2‑week kickoff plan and a costed 8‑week blueprint, and mandate deliverables for handoff (model exports, runbooks, monitoring dashboards, and a three‑session knowledge transfer). These items separate vendors that can actually ship production value from those that only sell concepts.

Machine learning consulting firms: how to choose a partner that delivers measurable value

Hiring a machine learning consulting firm should feel like hiring a teammate who turns an idea into measurable business results — not buying a mystery box of models and hope. Too often teams end up with slow pilots, black‑box demos, or proofs of concept that look impressive but never move the needle. This introduction explains why picking the right partner matters, what “measurable value” actually looks like, and how this guide will help you avoid common traps.

Good ML partners don’t just ship models. They help you frame the problem, baseline the KPIs you actually care about, clean and pipeline the data, build reliable models, and put observability and governance in place so those models keep delivering after launch. They also translate technical work into business outcomes — lift in conversion, fewer defects, lower churn, faster time‑to‑market — so you can hold projects to real ROI, not slide‑deck promises.

In this article you’ll find practical tools and expectations you can use right away: a simple scorecard for comparing firms, a set of 90‑day “value plays” you can ask for (so pilots aim at revenue or retention, not vanity metrics), and a realistic 12‑week blueprint for getting a safe, monitored model into production. We’ll also cover the contractual and security guardrails to require so you don’t get stuck with hidden IP, uncontrolled data flows, or unsupported systems.

If you’re deciding whether to hire a firm or build in‑house, this guide will help you weigh speed, cost, and long‑term maintainability — and give you the exact questions to ask during vendor interviews. Read on to learn how to find a partner who delivers measurable value, not just momentum.

What machine learning consulting firms actually deliver (and where they shouldn’t)

From strategy to production: discovery, data pipelines, modeling, MLOps, and change enablement

Good machine learning firms are not just model builders — they cover the full path from problem definition to live, measurable outcomes. Typical, valuable deliverables include:

When these pieces are delivered end-to-end, clients get both technical deliverables and the operational structures needed to extract sustained business value.

Avoid the traps: one-size-fits-all LLMs, black boxes without monitoring, vanity POCs

There are common failure modes to watch for when engaging consultants:

Ask for concrete evidence up front: reproducible experiments, data slices where performance is measured, and a delivery plan that includes monitoring, alerts, and remediation steps.

When to hire a firm vs. build in-house: talent leverage, speed-to-value, outside-in benchmarks

Deciding whether to partner or hire depends on several practical tradeoffs:

Frame the decision in terms of ownership, speed, risk, and future roadmap rather than purely short-term cost.

Engagement models you’ll see: advisory, build-with-your-team, build-and-run

Consulting firms commonly offer a few clear engagement patterns — know which you’re buying and what accountability comes with each:

Whichever model you choose, contractually specify deliverables, acceptance criteria tied to KPIs, documentation and training requirements, code and data ownership, and a clear transition plan to limit surprises.

Ready to convert these principles into concrete short-term wins? The next part walks through how to scope and demand measurable pilot projects that prove value quickly and set up a sustainable path to production.

90-day value plays to demand from your ML partner

Customer sentiment analytics to de-risk roadmaps and pricing (lift share and revenue with real voice-of-customer)

“Up to 25% increase in market share (Vorecol). 20% revenue increase by acting on customer feedback (Vorecol). 10% improved user activation rate in 1 month (Userpilot)” Product Leaders Challenges & AI-Powered Solutions — D-LAB research

What to ask your partner to deliver in 90 days:

Acceptance criteria and outputs you should insist on:

Competitive intelligence for product leaders to balance innovation with operational efficiency (cut time-to-market)

Fast, targeted competitive intelligence can shorten discovery and prioritization cycles. In 90 days demand:

Deliverables and KPI proof points:

AI sales agents and hyper-personalized content to grow pipeline and conversion without headcount

In a tightly scoped 90-day pilot, an ML partner can automate routine outreach and generate hyper‑targeted content to raise conversion while preserving governance:

What “good” looks like after 90 days:

Recommendation engines and dynamic pricing to increase deal size and margin

Target a minimum-viable production pipeline for recommendations and pricing in 90 days:

Acceptance criteria:

Product design optimization and simulation to prevent costly defects and technical debt

Use simulation and ML-driven optimization to catch design defects early and reduce rework:

Outputs to require within 90 days:

Across every play, insist on three non-negotiables from your partner: deliverables mapped to business KPIs, a clear path from prototype to production (including monitoring and rollback), and a handover package that transfers ownership to your team. With those in place, you’ll be positioned to evaluate partners objectively and move from pilots to predictable, measurable outcomes.

Scorecard to compare machine learning consulting firms

Technical depth and MLOps: reproducibility, monitoring, drift alerts, safe LLM ops

What to score and why: technical depth determines whether a firm can deliver production‑grade systems or only polished prototypes. Score vendors 1–5 on each dimension below and weight according to your priorities.

Data, privacy, and security: ISO 27002, SOC 2, NIST alignment and evidence

Trustworthy firms make security concrete. Request evidence — not just claims — and score vendors on proof and operational maturity.

“Average cost of a data breach in 2023 was $4.24M (Rebecca Harper).” Deal Preparation Technologies to Enhance Valuation of New Portfolio Companies — D-LAB research

“Europes GDPR regulatory fines can cost businesses up to 4% of their annual revenue.” Deal Preparation Technologies to Enhance Valuation of New Portfolio Companies — D-LAB research

Speed-to-value: 12-week pilot plan, KPI commitments, and risk‑sharing models

Speed-to-value should be measurable. Score proposals on concreteness of timeline, KPI commitments, and commercial alignment.

IP and maintainability: code ownership, documentation, handover, and tech debt plan

Long-term value comes from maintainable IP and clear ownership. Score firms on legal, technical, and operational handover practices.

Proof that matters: case studies with before/after metrics, not just logo walls

Claims are cheap; measurable proofs are not. Compare evidence quality across vendors and give higher scores to quantified outcomes.

How to use the scorecard: assign weights to categories that match your priorities, score each vendor 1–5 per line item, and compute a weighted total. Use the results to short-list vendors for a closed tender or a tight 12‑week pilot with contractual KPIs and handover obligations.

With a short-list and a score-driven RFP in hand, the next step is to translate those must-have items into contractual clauses, technical controls, and governance checks so you get measurable, auditable outcomes from your partner.

Thank you for reading Diligize’s blog!
Are you looking for strategic advise?
Subscribe to our newsletter!

Data, security, and IP guardrails you should require

PII minimization and governance: least privilege, lineage, and synthetic data options

Before any work begins, insist on a clear data governance plan that shows how client data will be classified, accessed, and reduced to the minimum necessary for the task.

Cybersecurity-by-design: access controls, audit logs, incident response runbooks

Treat the vendor’s security posture as part of the deliverable. Ask for operational evidence, not just high‑level claims.

Model governance: provenance, red‑teaming, bias tests, eval benchmarks, rollback plans

Models must be governed like any other critical piece of infrastructure. Build governance checkpoints into delivery and operations.

Contract terms: IP ownership, data residency, retraining rights, and vendor lock‑in protections

Translate technical requirements into explicit contract language so you preserve long‑term control and avoid surprises.

Quick vendor checklist you can use in RFPs or SOWs:

Agreeing these guardrails up front turns security, privacy, and IP from afterthoughts into measurable deliverables — and creates the conditions to run short, auditable pilots that can be safely scaled into production. Once these legal and technical foundations are in place, you can move quickly into a time‑boxed execution plan that proves value while preserving control.

A practical 12‑week blueprint to reach production safely

Weeks 1–2: problem framing, KPI baseline, data audit, and success criteria

Kick off with a tight, business‑led discovery that converts hopes into measures. Objectives for this phase:

Weeks 3–6: prototype, labeling/feature work, offline evaluation with business‑relevant metrics

Move fast but measure everything. This block proves whether the idea has signal and a path to impact.

Weeks 7–9: integration, CI/CD for ML, observability, security/privacy review

Translate the prototype into a production‑ready artifact with safety, repeatability, and operational visibility.

Weeks 10–12: pilot launch, user feedback loop, governance sign‑off, runbook and handover

Run a controlled pilot, measure real impact, and complete the transfer of ownership.

Acceptance criteria and risk controls to embed across the 12 weeks

Apply these non‑negotiable controls to limit surprises and preserve production safety.

Use this blueprint as a negotiation tool: require vendors to map their proposed work to these weeks, deliverables, and acceptance criteria in the SOW so that pilots are auditable, bounded, and safely convertible to production when they prove value.

Machine learning consulting companies: how to pick a partner that moves revenue in 90 days

Hiring a machine learning partner shouldn’t feel like rolling the dice. Too many teams hand over data and wait months for a “proof” that never turns into predictable revenue. This guide is for product leaders, revenue heads, and founders who need ML that actually moves the business — fast. We’ll focus on practical ways to find a partner who can deliver measurable revenue in roughly 90 days, not just research papers or vaporware.

Over the next few minutes you’ll get a clear playbook: how to shortlist vendors in 10 days, which high‑ROI ML use cases to prioritize, what a realistic timeline and pricing model looks like, and a simple scorecard to compare firms side‑by‑side. We’ll also call out the red flags that usually mean you’re buying a science project instead of a revenue engine.

This isn’t about buzzwords. Expect plain checkpoints you can use in real meetings:

  • How to demand a “time‑to‑first‑value” plan with KPIs and baselines.
  • Which security and compliance proofs matter (so IP and customer data stay safe).
  • What MLOps handover should look like so your team owns the models long‑term.
  • Which proof-of-production references to ask for — and the before/after metrics that prove impact.

Read on if you want a no‑nonsense way to choose a partner who treats your revenue goals like product requirements, not academic curiosity. If you prefer to jump straight to the shortlist checklist and scorecard, look for the quick “Shortlist in 10 days” section — it’s designed to get you moving this week.

What the best machine learning consulting companies deliver today

Revenue growth in B2B: ABM, omnichannel, and personalization

Top ML consultancies translate buyer-behaviour shifts into repeatable revenue programs: account‑based playbooks powered by intent signals, AI sales agents that automate qualification and outreach, and hyper‑personalized content at scale tied to closed‑loop measurement. They pair engineering with GTM playbooks so pilots move pipeline, not just proofs of concept.

“71% of B2B buyers are Millennials or Gen Zers. These new generations favour digital self-service channels (Tony Uphoff).” B2B Sales & Marketing Challenges & AI-Powered Solutions — D-LAB research

“Buyers are independently researching solutions, completing up to 80% of the buying process before even engaging with a sales rep.” B2B Sales & Marketing Challenges & AI-Powered Solutions — D-LAB research

“40-50% reduction in manual sales tasks. 30% time savings by automating CRM interaction (IJRPR). 50% increase in revenue, 40% reduction in sales cycle time (Letticia Adimoha).” B2B Sales & Marketing Challenges & AI-Powered Solutions — D-LAB research

Product velocity with lower risk: sentiment loops and design optimization

Leading firms embed ML into product development: continuous voice‑of‑customer and sentiment loops to prioritise features, together with simulation, optimisation and digital‑twin techniques to shift defect detection left. The result is faster shipping with materially lower technical and market risk.

“50% reduction in time-to-market by adopting AI into R&D (PWC).” Product Leaders Challenges & AI-Powered Solutions — D-LAB research

“Skilful improvements at the design stage are 10 times more effective than at the manufacturing stage- David Anderson (LMC Industries).” Product Leaders Challenges & AI-Powered Solutions — D-LAB research

“Finding a defect at the final assembly could cost 100 times more to remedy.” Product Leaders Challenges & AI-Powered Solutions — D-LAB research

Retention and CX: customer health scoring and AI agents

Consultancies that drive near‑term revenue focus on retention as much as acquisition: they deploy customer‑health ML models, automated playbooks for at‑risk accounts, and GenAI assistants that improve agent efficiency and identify expansion opportunities in real time. These interventions convert product usage and support signals into measurable renewal lift.

“10% increase in Net Revenue Retention (NRR) (Gainsight).” Deal Preparation Technologies to Enhance Valuation of New Portfolio Companies — D-LAB research

“20-25% increase in Customer Satisfaction (CSAT) (CHCG). 30% reduction in customer churn (CHCG).” Deal Preparation Technologies to Enhance Valuation of New Portfolio Companies — D-LAB research

Security and IP protection: SOC 2, ISO 27002, NIST 2.0 baked in

Enterprise‑grade ML partners treat security and IP as a built‑in requirement: data governance, threat modelling, automated monitoring, and compliance frameworks are part of the delivery plan so models can be deployed to production without a valuation haircut or legal risk. This is non‑negotiable for buyers and investors.

“Average cost of a data breach in 2023 was $4.24M (Rebecca Harper).” Deal Preparation Technologies to Enhance Valuation of New Portfolio Companies — D-LAB research

“Europes GDPR regulatory fines can cost businesses up to 4% of their annual revenue.” Deal Preparation Technologies to Enhance Valuation of New Portfolio Companies — D-LAB research

“A framework developed by the American Institute of CPAs (AICPA) focusing on controls related to security, availability, processing integrity, confidentiality, and privacy.” Deal Preparation Technologies to Enhance Valuation of New Portfolio Companies — D-LAB research

Those four delivery pillars—revenue acceleration, de‑risked product velocity, measurable retention uplift, and compliance‑first security—are what separate pilots from projects that start moving the top line in weeks. With that capability map in mind, the next step is choosing which specific ML use cases to prioritise so you capture the fastest, highest‑ROI wins.

High-ROI ML use cases to put on your shortlist

AI sales agents for pipeline and outreach automation — 40–50% task cut, up to 50% revenue lift

What it is: Autonomous or semi‑autonomous agents that ingest CRM and external signals to qualify leads, draft personalised outreach, schedule meetings and automate routine CRM updates.

Why it’s high‑ROI: It frees sellers to focus on high‑value conversations, reduces manual data work, and turns idle signals into actionable pipeline. Early deployments are typically narrow (one team or channel) so value appears quickly.

How to pilot: Start with a single segment and a controlled set of workflows (lead scoring → outbound email templates → meeting scheduling). Track conversion lifts, time saved per rep, and data quality improvements.

What to ask a partner: Which data connectors they support, how they handle hallucination and auditability of messages, and what escalation/playbook they implement when the agent flags a high‑value lead.

GenAI sentiment and journey analytics — +20% revenue, +25% market share

What it is: Natural language and behavioural models that turn support tickets, product usage, sales conversations and survey text into prioritised insights and journey maps.

Why it’s high‑ROI: It turns qualitative feedback into a continuous prioritisation signal for product and GTM teams so you stop guessing which fixes or messages move the needle.

How to pilot: Pull a single source (e.g., support transcripts or NPS comments), run a month of sentiment and root‑cause analysis, and deliver a ranked backlog of changes tied to expected business outcomes.

What to ask a partner: How they validate sentiment models against business outcomes, how they maintain training data freshness, and which stakeholders they embed the insights with (product, CS, marketing).

Hyper-personalized ABM content and offers — +50% conversions, +40% open rates

What it is: Models that assemble and deliver tailored content, landing pages and offers to named accounts using CRM signals, intent data and behavioural context in real time.

Why it’s high‑ROI: Personalisation at scale turns accounts that were previously unresponsive into engaged prospects by making every touch relevant and timely.

How to pilot: Pick a small ABM cohort, replace a baseline campaign with a personalised variant, and measure lift in engagement and pipeline. Integrate the content engine with your CMS and email platform for full measurement.

What to ask a partner: How they handle creative controls and brand voice, how they measure attribution across channels, and how personalization decisions are explainable to marketers and legal.

Buyer-intent discovery beyond your CRM — +32% close rate, shorter cycles

What it is: Systems that ingest third‑party intent signals (content consumption, vendor comparisons, conference attendance) and match them to your ICP to surface buyers researching solutions outside your owned channels.

Why it’s high‑ROI: It converts anonymous research into proactive outreach opportunities, shortening cycles and improving lead quality without increasing paid acquisition spend.

How to pilot: Define the intent signals that best map to your high‑value deals, run a short enrichment and alerting workflow for SDRs, and measure sourced pipeline and conversion rate from these signals.

What to ask a partner: Their signal sources and privacy posture, how they reduce false positives, and how they ensure alerts integrate into your existing sales cadence.

Recommendation engines and dynamic pricing — +10–15% revenue, 2–5x profit gains

What it is: Recommendation systems that personalise product/service suggestions at the point of decision, paired with pricing models that adapt offers to customer segment, inventory and competitive context.

Why it’s high‑ROI: These models increase average order value and conversion by surfacing the right item at the right price and reducing revenue left on the table from static pricing.

How to pilot: Start with a low‑risk placement (e.g., a “recommended for you” module or a secondary product line) and run A/B tests against static controls. For pricing, use a narrow category and simulate impact before live rollout.

What to ask a partner: How they balance short‑term revenue vs long‑term margin, their approach to offline evaluation and safety checks, and how they connect recommendations to downstream fulfillment and returns data.

These five use cases are practical, had a track record of rapid payback in many organisations, and map cleanly to measurable business levers (pipeline, conversion, retention, average deal size). Once you have prioritised the one or two that best match your data and commercial goals, you need a fast, evidence‑based process to separate vendors who can deliver first value from those who can only theorise about it.

How to shortlist machine learning consulting companies in 10 days

Show the value plan: KPIs, baselines, time-to-first-value

Day 1–2: ask each vendor to map your top commercial objective (revenue, retention, deal size, time‑to‑close) to a concrete KPI and a measurable baseline. Demand a one‑page value plan that shows the first measurable outcome, the success gates, and the minimal scope required to prove value within the 10‑day window.

Use that plan as a go/no‑go filter: if the vendor cannot define an ownerable KPI, a clear data baseline and a realistic first‑value milestone you can measure in weeks, they stay off the shortlist.

Security by design: SOC 2 / ISO 27002 / NIST 2.0 fluency

Security posture should be a checklist item, not optional. Request their evidence of framework familiarity, how they separate and anonymise production data for dev/test, and the controls they will put in place during the engagement (access controls, encryption, retention policies).

Insist on contractual protections covering data use, IP, and breach response responsibilities. If a vendor treats security as an afterthought, they aren’t ready for production‑grade work.

MLOps you can own: CI/CD, monitoring, retraining schedules

Evaluate whether the partner builds with handover in mind: ask for the CI/CD pipeline architecture, automated testing strategy, monitoring and alerting plans, and an agreed retraining cadence. The goal is a solution your internal team can operate or a reproducible runbook you can take over.

Small proof: request a sample deployment diagram and a short checklist showing how a model rollback or emergency retrain would be executed—if they can’t provide it quickly, they’ll create operational risk later.

Domain fluency in B2B GTM: ABM, CRM, martech, data contracts

Prioritise partners who understand your go‑to‑market stack and data flows. Ask for concrete examples of integrations with CRMs, marketing platforms, intent vendors or data contracts the vendor has implemented. Domain context reduces discovery time and exposes practical constraints up front.

During calls, test their fluency with scenario questions (e.g., how they’d enrich CRM records, or which signals they’d prioritise for an ABM pilot). If answers are vague, move on.

Proof of production: references with before/after metrics

Demand references that include before/after metrics, not just testimonials. Ask for a short case study or a demo environment where you can see the models operate against anonymised data. Verify the partner can show the instrumentation they used to measure impact.

Prefer vendors who share reproducible artifacts (sample notebooks, deployment scripts, monitoring dashboards) and are willing to run a short live demo against a slice of your data during the 10‑day window.

Red flags you’re buying a science project

Watch for promises without baselines, opaque timelines, or custom research budgets that are open‑ended. Other red flags: single‑person dependency, no clear handover plan, lack of automated tests/monitoring, and reluctance to sign simple success‑based milestones.

If the vendor’s answers to basic operational questions are vague, or they defer all measurable outcomes to a later “research” phase, they’re likely to deliver models you can’t put into production quickly.

Run this checklist as a focused 10‑day sprint: request the one‑page value plan up front, validate security and MLOps during technical calls, and close the loop with references and a short live demo. Once you have a small, evidence‑backed shortlist, the natural next step is to align on delivery cadence, commercial structure and the exact handover commitments so the winning partner can start delivering measurable outcomes immediately.

Thank you for reading Diligize’s blog!
Are you looking for strategic advise?
Subscribe to our newsletter!

Pricing, timelines, and engagement models that work

2–3 week discovery to de-risk data and scope

Run a time‑boxed discovery to prove feasibility and remove unknowns quickly. Core deliverables: a data inventory, access checklist, mapped stakeholders, prioritized use‑case list, and a one‑page success plan (KPIs, baseline, minimal scope to prove value). Treat discovery as a gated purchase: it either confirms a 4–6 week prototype is viable or it stops further spend.

4–6 week value prototype with success gates

Use a short, outcome‑focused prototype to deliver the first measurable lift. The prototype should produce an MLP (minimum lovable product) that integrates with one business process, includes an evaluation plan (A/B test or before/after), and defines clear success gates tied to the KPI. Keep scope narrow: one dataset, one channel, one decision point.

6–12 week pilot-to-production with MLOps and handover

For pilots that pass success gates, plan a 6–12 week production push that includes hardened pipelines, automated tests, monitoring, retraining schedules and a documented handover. Deliverables should include deployment scripts, runbooks, a monitoring dashboard, rollback procedures and a knowledge transfer plan so your team can operate or safely transition to an internal owner.

Commercials: milestone-based, capped sprints, value-at-risk options

Prefer commercial models that align vendor incentives with your outcomes. Common structures that work: fixed‑price discovery, capped time & materials for prototype sprints, milestone payments tied to success gates, and optional value‑at‑risk or success fees for production milestones. Insist on clear change control, a cap on total spend per sprint, and simple SLAs for data handling and uptime during pilots.

Team shape: lean pod vs. augment—when each fits

Choose team structure based on capability and speed needs. Lean pod (product manager, ML engineer, data engineer, designer) works when you want an end‑to‑end partner who owns delivery and can move fast. Augment (specialist engineers embedded in your teams) is better when you have strong internal product and platform teams and need specific skills. Evaluate vendor availability, ramp time, and commitment to handover when selecting the model.

Practical contract must‑haves: defined ownership of IP, clear data and security commitments, measurable success gates, a transfer and termination plan, and a short roadmap for post‑pilot support. Locking these elements into the timeline and commercials reduces ambiguity and speeds decision‑making. With these timelines and models clarified, you’ll be ready to apply a structured comparison across vendors so you pick the partner most likely to deliver measurable outcomes quickly.

Scorecard to compare machine learning consulting companies

Business impact design (25%)

What it measures: how well the vendor maps ML work to clear commercial outcomes (revenue, retention, deal size) and whether they provide a realistic value plan with baselines and success gates.

Evidence to request: one‑page value plan, KPI definitions, baseline data sources, expected delta and timeline, and an owner responsible for delivering the outcome.

Scoring (0–5): 5 = concrete KPI + baseline + measurable first‑value milestone; 3 = plausible KPI but vague baseline or timeline; 0 = no measurable business linkage.

Speed to value and execution (20%)

What it measures: vendor’s ability to deliver first measurable results quickly and their track record running short discovery/prototype sprints.

Evidence to request: sample sprint plans, real examples of 4–6 week prototypes, references that confirm time‑to‑first‑value, and resource availability for your schedule.

Scoring (0–5): 5 = repeatable sprint approach + verified short wins; 3 = structured approach but limited verified speed; 0 = open‑ended research plans only.

Data readiness and governance (15%)

What it measures: how the partner assesses, cleans, connects and governs your data, including lineage, ownership and anonymisation practices.

Evidence to request: data inventory template, sample data contracts, ETL/ingestion approach, and policies for dev/test separation and PII handling.

Scoring (0–5): 5 = clear data playbook + automated pipelines + governance artifacts; 3 = manual processes with a plan; 0 = no practical data plan.

Reliability, monitoring, and model life-cycle (15%)

What it measures: maturity of the partner’s MLOps practices — CI/CD, automated testing, monitoring, alerting, retraining cadence and rollback procedures.

Evidence to request: deployment diagrams, monitoring dashboards, retraining schedule, SLAs for model performance degradation, and a sample runbook for incidents.

Scoring (0–5): 5 = production‑grade MLOps + documented handover; 3 = partial automation with manual steps; 0 = no lifecycle plan.

Security and compliance posture (15%)

What it measures: the vendor’s familiarity with security frameworks, data protection controls, contractual commitments and incident response capabilities.

Evidence to request: summary of compliance frameworks they operate under, example contractual clauses for data/IP protection, encryption and access control practices, and a breach response plan.

Scoring (0–5): 5 = documented controls + contractual protections; 3 = basic controls but limited contractual assurances; 0 = security treated as optional.

Enablement and change management (10%)

What it measures: the partner’s ability to transfer ownership, train teams, create operational documentation and drive adoption so models generate sustained value.

Evidence to request: enablement curriculum, handover schedule, training records from past clients, and a plan for embedding insights into business processes.

Scoring (0–5): 5 = comprehensive enablement + measurable adoption plan; 3 = limited training with some handover artifacts; 0 = no enablement plan.

How to compute and interpret the final score

Step 1: score each criterion 0–5. Step 2: convert to weighted points by multiplying each score by its weight (e.g., score × 25% for Business impact). Step 3: sum the weighted points to get a total out of 5.0.

Quick interpretation: ≥4.0 = strong fit (likely to deliver measurable outcomes); 3.0–4.0 = conditional fit (requires contractual protections or narrow scope); <3.0 = high risk (probable research project).

Practical tips for using the scorecard

Use the same evidence checklist for every vendor to ensure apples‑to‑apples comparison. Prioritise the criteria that matter most to your organisation (you can reweight) and require at least one reference that validates the vendor’s claim for each top‑weighted criterion.

Collect the scorecard results before commercial negotiation — the numeric output should drive milestone structure, success fees and handover requirements in the contract.

Deep learning consulting that drives measurable value

Deep learning feels like a fast-moving promise: smarter products, better predictions, and automation that can change the shape of your business. But for many teams the real question isn’t whether deep learning is cool — it’s whether it actually moves the needle on revenue, risk, or customer experience. This post walks through practical ways consulting can turn deep learning from an experimental project into measurable value you can take to the board.

Why focus on consulting? Building models in a lab is different from putting them into the systems that run your business. Left unchecked, AI projects create technical debt, security gaps, and missed deadlines. The stakes are real — the average cost of a data breach reached roughly $4.45 million in IBM’s 2023 report, which shows how quickly technical and security problems can become expensive (source: IBM — Cost of a Data Breach Report 2023).

On the upside, the right applications of deep learning can deliver clear commercial wins. For example, personalization and recommendation work have been shown to increase revenue substantially — McKinsey research cites typical uplifts in the 10–30% range when personalization is done well (source: McKinsey — The value of getting personalization right).

Over the next sections you’ll find concrete frameworks: how to spot when deep learning (not just classical ML) is the right tech, high‑ROI use cases to present to leadership, a low‑risk pilot blueprint that proves ROI in weeks, and the controls you need for security, IP, and operational resilience. If you want less hype and more practical next steps, read on — this is about getting measurable outcomes, not models that live in a notebook.

What deep learning consulting solves for your business right now

Balance innovation with operational efficiency

Deep learning consulting helps you prioritize the experiments and pilots that actually move KPIs, rather than chasing every emerging idea. Consultants map use cases to measurable outcomes, design lean pilots that prove value, and build integration plans that keep production systems stable. The result: accelerated innovation without the operational drag that typically follows poorly scoped AI projects.

Reduce technical debt without slowing your roadmap

“91% of CTOs see this as their biggest challenge (Softtek).” Product Leaders Challenges & AI-Powered Solutions — D-LAB research

“Over 50% of CTOs say technical debt is sabotaging their ability to innovate and grow.” Product Leaders Challenges & AI-Powered Solutions — D-LAB research

“99% of CTOs consider technical debt a risk because the longer it takes to address, it the more complicated it becomes.” Product Leaders Challenges & AI-Powered Solutions — D-LAB research

Practical deep learning engagements reduce technical debt by enforcing modular architectures, versioned models, and clear acceptance gates. Consultants replace ad hoc model releases with reproducible training pipelines, automated tests, and rollback plans so you can iterate quickly without accumulating brittle, unmaintainable systems. That lets product teams keep pace while the platform matures under disciplined MLOps practices.

Build security and IP protection in from day one

“Average cost of a data breach in 2023 was $4.24M (Rebecca Harper).” Deal Preparation Technologies to Enhance Valuation of New Portfolio Companies — D-LAB research

“Europes GDPR regulatory fines can cost businesses up to 4% of their annual revenue.” Deal Preparation Technologies to Enhance Valuation of New Portfolio Companies — D-LAB research

Deep learning consulting embeds security and IP controls into model design and deployment: data minimization, encryption, access controls, audit trails, and model provenance. Engineers couple ML risk assessments with compliance frameworks and threat modeling so your models strengthen, rather than weaken, enterprise valuation and buyer confidence.

Prep for “customer machines” and automated buyers

“CEOs expect 15-20% of revenue to come from Machine Customers by 2030.” Product Leaders Challenges & AI-Powered Solutions — D-LAB research

“49% of CEOs agree that Machine Customers will begin to be significant from 2025” Product Leaders Challenges & AI-Powered Solutions — D-LAB research

Consulting teams prepare systems for machine-to-machine buyers by hardening APIs, standardizing data contracts, and building latency- and accuracy-guaranteed inference pipelines. They simulate automated buyer behavior, design explainable decision logic, and ensure commercial controls so your product can be reliably consumed by other software at scale.

When deep learning (not just ML) is the right fit

Deep learning is the right choice when you face large volumes of unstructured or multimodal data (text, images, audio), need transfer learning across tasks, or require models that learn complex patterns at scale. Good consulting assesses data readiness, compares simpler alternatives, and recommends architectures that justify the incremental cost and complexity of deep models. That evaluation prevents overengineering while unlocking opportunities where deep learning delivers outsized ROI.

With those operational, security, and strategic risks addressed, the natural next step is to move from problems to concrete, board-ready use cases and the evidence you can take into budget and executive conversations.

High-ROI deep learning use cases with proof you can take to the board

Voice of customer and sentiment analysis that lifts market share

Problem: product and go‑to‑market teams are flying blind on which features and messages move revenue. Deep learning applied to customer feedback, reviews, support transcripts and social data uncovers what customers actually value, prioritizes features, and surfaces churn risk earlier.

Proof to the board: “Up to 25% increase in market share (Vorecol).” Product Leaders Challenges & AI-Powered Solutions — D-LAB research

Proof to the board: “20% revenue increase by acting on customer feedback (Vorecol).” Product Leaders Challenges & AI-Powered Solutions — D-LAB research

What to present: show uplift scenarios (conservative, base, upside), sample signals the model will use, and a 6–12 month roadmap from pilot to controlled rollout that ties model outputs to concrete product and marketing actions.

Recommendation engines and dynamic pricing to grow deal size

Problem: sales and ecommerce teams miss high-value cross-sell and upsell opportunities because product recommendations and prices are static or rule-based. Deep learning personalizes offers in real time and optimizes price points against demand and margin.

Proof to the board: “30% increase in cross-sell conversion rates for B2C, and 25% for B2B (Affine), (Steve Eveleigh).” Deal Preparation Technologies to Enhance Valuation of New Portfolio Companies — D-LAB research

Proof to the board: “Up to 30% increase in average order value (Terry Tolentino).” Deal Preparation Technologies to Enhance Valuation of New Portfolio Companies — D-LAB research

What to present: expected revenue lift per cohort, A/B test design for a staged rollout, and guardrails (margin floors, fairness checks, and immediate rollback triggers) so the board sees both upside and control measures.

Computer vision for quality control, inventory, and document capture

Problem: manual inspection, inventory counting, and document processing are slow, error-prone, and expensive at scale. Modern deep learning vision models reduce human error, speed throughput, and enable new automation where cameras and PDFs are the primary inputs.

How deep learning helps: automated defect detection in production lines, visual inventory reconciliation, and OCR + semantic parsing for high‑volume document intake. Typical board-level asks are reduced cost per inspection, faster cycle times, and fewer late-stage defects that hit margins.

What to present: a pilot plan with key metrics (precision/recall for defects, time per count, percent reduction in manual processing), a sample dataset, and estimated payback period driven by fewer defects and lower labor costs.

Decision intelligence for product leaders: faster, safer bets

Problem: investment choices about features, pricing, and channels are high-stakes and often based on incomplete signals. Decision intelligence layers model-driven scenario analysis on top of business metrics so leaders make faster, more defensible bets.

Proof to the board: “50% reduction in time-to-market by adopting AI into R&D (PWC).” Product Leaders Challenges & AI-Powered Solutions — D-LAB research

What to present: the decision pipeline (data → model → decision playbook), sample scenarios showing lift/risks, and acceptance gates that convert model recommendations into accountable product actions.

Tying it together: for each use case bring a crisp ROI hypothesis, a one-page pilot plan with success criteria, and a path to production that includes monitoring and rollback. That package turns technical novelty into board-ready investment cases and makes it easy for executives to approve targeted funding while keeping operational risk contained.

Next, we’ll outline a practical launch plan with timelines, acceptance gates and the operational guardrails that protect value as you scale these pilots into production.

A low‑risk blueprint to launch and scale deep learning

Readiness and data audit tied to a single ROI hypothesis

Start with one clear, measurable ROI hypothesis — the single business metric a model must move (e.g., reduce defect rate, lift upsell conversion, or cut average handling time). Run a short readiness audit focused on signal quality: how much relevant data exists, where it lives, labeling gaps, and integration points. The goal is a one‑page verdict that says “go/no‑go” and lists the minimal cleanups required to run a meaningful pilot.

Pilot in 6–10 weeks: baselines, offline tests, acceptance gates

Design a time‑boxed pilot with three deliverables: baseline metrics, a reproducible offline evaluation, and concrete acceptance gates for production (precision/recall, latency, business KPI delta). Keep scope narrow — one model, one dataset, and one decision flow — so you can iterate fast. Use A/B or shadow deployments as intermediate checks before any user‑facing rollout.

MLOps you can run: versioning, monitoring, rollback plans

Operationalize with simple, automatable controls: model and data versioning, reproducible training pipelines, continuous evaluation on holdout sets, and real‑time monitoring for data drift and performance regressions. Define automatic and human approval thresholds and a tested rollback procedure so an engineer can revert a bad model in minutes, not days.

Security‑by‑design: ISO 27002, SOC 2, and NIST baked in

Embed security and IP controls from day one: limit data access using roles, log and audit every model training and inference, and encrypt sensitive datasets in transit and at rest. Align the implementation to common frameworks and make evidence available for audits so compliance and valuation risks are reduced as you scale.

Enablement: docs, playbooks, and team training

Deliverables must include operational docs, runbooks, and a short playbook for product and support teams that explains model behavior, failure modes, and escalation paths. Run a hands‑on training session for the engineers and product owners who will own the model post‑launch so knowledge transfer is explicit and measurable.

When the pilot meets its gates and teams are enabled, the next step is to convert this blueprint into the financials and delivery timelines stakeholders need to sign off on and scale the program responsibly.

Thank you for reading Diligize’s blog!
Are you looking for strategic advise?
Subscribe to our newsletter!

Costs, timelines, and ROI benchmarks

What drives cost: data quality, labeling, infra, integration

Costs concentrate where you have the weakest signal or the biggest integration surface. Major drivers are: data work (cleaning, deduplication, feature engineering), high‑quality labeling and annotation, training and inference compute (GPU/TPU), storage and networking, and engineering effort to integrate models into existing stacks and workflows. Compliance, security and governance (access controls, encryption, audit logs) add recurring costs as well.

To control spend, target transfer learning and pre‑trained models, invest in labeling tooling and guidelines once (not ad hoc), use mixed infra strategies (spot instances + reserved capacity), and scope integration as a phased effort so core value is delivered before broad rollout.

Typical timelines by use case (NLP, CV, recommender systems)

Expect two distinct phases: a short, evidence‑focused pilot and a longer production phase that includes integration, monitoring and enablement. Typical pilot windows (one model, one dataset, measured KPI): NLP: ~6–10 weeks; computer vision: ~8–14 weeks; recommendation systems: ~6–12 weeks. If data readiness is low, add 2–6 weeks for labeling and cleansing.

Production timelines depend on integration complexity and compliance requirements. A conservative path is 3–9 months from pilot start to first controlled production release; full enterprise rollout with monitoring, SLAs and training often spans 6–18 months. Always build acceptance gates (offline metrics, shadow runs, A/B tests) so go/no‑go decisions are objective.

Benchmarks: time‑to‑market, CSAT, revenue and retention lifts

“Benchmarks show 20–25% increases in CSAT, up to 20% revenue uplift from acting on customer feedback, up to 25% market share gains in some cases, and ~30% reductions in churn following targeted AI deployments.” KEY CHALLENGES FOR CUSTOMER SERVICE (2025) — D-LAB research

When you take ROI to the board, present three scenarios (conservative, base, upside) with clear assumptions (sample size, cohort, conversion uplift, retention delta). Use simple financials: expected incremental revenue, cost savings (FTE reductions or reallocation), implementation cost, and payback period. Highlight leading indicators you will monitor weekly (model precision/recall, inference latency, feature adoption) and the business KPIs you’ll report monthly.

Finally, show sensitivity: a 1–2% change in conversion or churn assumptions can materially alter payback, so propose a short pilot that validates those assumptions quickly and limits capital at risk. This makes it straightforward for executives to approve targeted funding while preserving an easy exit if the metrics don’t materialize.

With those financials and timelines clarified, the next step is to evaluate partners and delivery models so you can choose an engagement that guarantees the technical controls and business outcomes you just costed out.

How to pick a deep learning consulting partner (and spot red flags)

Evidence of value, not vanity metrics

Ask for concrete, comparable outcomes: before/after KPIs, cohort definitions, the size and timeframe of tests, and contacts you can call. A good partner will show a clear ROI hypothesis per engagement and be able to point to a repeatable process that produced the result, not just screenshots or nebulous percentage claims.

Red flags: only dashboard screenshots, vague success stories without metrics, or refusal to share anonymized references or test designs.

Security credentials and data handling in writing

Require written descriptions of how they handle data end-to-end: access controls, encryption practices, data retention, and how they will separate and return or delete your data after the engagement. Ask for evidence of independent assessments or third‑party audits where available, and insist these controls are captured in the contract (including breach notification timelines and liability allocation).

Red flags: evasive answers about who can access your data, no written policy, or blanket statements about security without contractual commitments.

Tooling and cloud neutrality with hands-on delivery

Prefer partners who can operate across multiple clouds and also deliver working code, not just notebooks. They should provide reproducible pipelines, versioned artifacts, and an exit plan that prevents vendor lock‑in (for example, documented infra-as-code and containerized deployments you can run yourself).

Red flags: insistence on single‑vendor managed services with no migration path, delivery that stops at prototypes, or lack of demonstrable CI/CD and observability practices.

Post‑launch support: SLAs, monitoring, and ownership transfer

Clarify post‑launch responsibilities up front: who owns monitoring, incident response, model retraining, and cost of ongoing inferencing. Expect a written SLA for availability and performance, a runbook for common failures, and a formal knowledge‑transfer plan that includes documentation and workshops for your teams.

Red flags: one‑off handoffs without runbooks, indefinite dependence on the consulting team to operate the system, or ambiguous pricing for ongoing support.

Choose a partner who treats your success as measurable and transferable: insist on references, written security and data commitments, clear delivery artifacts, and a documented plan for handover. That combination keeps risk low while making the business case for scaling successful pilots.

Adaptive learning in artificial intelligence: what actually works in 2025

Adaptive learning is no longer a buzzword or a set of if/then lesson branches. By 2025 it’s becoming a practical toolkit: student models that update in real time, policies that decide the next best activity, and content graphs that route learners to exactly the skill they need next. This article peels back the hype and asks a simple question — what actually works, right now — and shows how to get there without gambling your budget or your students’ trust.

If you’ve been frustrated by one-size-fits-all curricula, overflowing teacher inboxes, or pilots that looked promising on a slide deck but fizzled in the classroom, you’re in the right place. We’ll cover the signals that matter (knowledge state, engagement, context), the core models people actually deploy, and the three practical levels of adaptivity — from item tweaks to whole-program pacing — so you can pick the right scope for your goals.

This isn’t theory. You’ll find a clear, non-technical 90‑day plan to run a pilot, real high‑ROI use cases you can launch this quarter, and the guardrails you must put in place so adaptivity stays fair, private, and interpretable. No vendor fluff — just the steps and measurements that tell you whether adaptation helps students and reduces real teacher workload.

Read on if you want a straight answer about what works in adaptive learning today, what to test first, and how to measure success so your next investment actually moves the needle.

Please proceed now without external Google citations — keep claims conceptual and avoid quoting external sources. I’m ready for you to produce the section in the exact HTML format requested.

Why it matters now: budget pressure, burnout, and proficiency gaps

Teacher workload relief: 4 hrs/week saved on lesson planning, 11 hrs/week on admin

“AI-powered teacher assistants can cut routine workload substantially — teachers save about 4 hours per week on lesson planning and up to 11 hours per week on administration and student evaluation.” Education Industry Challenges & AI-Powered Solutions — D-LAB research

Those headline savings matter because they translate directly into instructional capacity. When adaptive systems take over repetitive tasks—generating practice items, drafting feedback, flagging students who need intervention—teachers regain time for small-group instruction, differentiated coaching and social‑emotional support. The catch: systems must be integrated into teachers’ workflows and auditable, so automation reduces friction instead of creating extra review work.

Student outcomes: up to 200% academic growth and 25% higher engagement with AI tutors

“Deployments of AI tutoring and virtual student assistants have reported up to 200% academic growth and roughly a 25% boost in student engagement.” Education Industry Challenges & AI-Powered Solutions — D-LAB research

Adaptive tutoring that diagnoses gaps, sequences practice, and revisits forgotten material can accelerate proficiency—especially for students who missed chunks of learning. Higher engagement follows when content matches current ability and interest. Still, such gains are not automatic: they require strong alignment between curriculum goals, assessment design and the adaptivity strategy, plus clear evaluation to separate novelty effects from sustained learning.

R&D efficiency in universities: 10x faster screening, 300x quicker data processing

AI is already reshaping research workflows. Automating literature triage, extracting structured data from papers, and prioritizing experiments compress the time from question to insight. That improves throughput on constrained R&D budgets and makes it feasible to run more rigorous pilots of adaptive learning at scale.

From data-rich to insight-ready: reducing technical debt to unlock real-time decisions

Many institutions hold large volumes of LMS logs, assessment records and administrative data—but operationalizing those signals for adaptivity requires clean, timely pipelines. Reducing technical debt (consistent identifiers, standardized metadata, real‑time event streams) is the prerequisite for trustworthy, low-latency personalization. Without it, “adaptive” rules default to coarse heuristics that create false positives, overexpose items, or withhold needed practice.

Security first: education’s cyber risk is now “high”—design privacy and resilience in

As schools and universities connect more systems and collect richer learner signals, attack surface and privacy risk rise. Designing least‑privilege data flows, minimizing PII exposure, and treating models as assets to be monitored and patched are essential. Security and clear consent practices are not optional add-ons; they determine whether adaptive systems are sustainable and acceptable to educators, students and families.

Together, these pressures—tight budgets, teacher burnout, uneven proficiency, and rising operational risk—make adaptive learning less a luxury and more a practical lever for efficiency and impact. The next question is how to translate these priorities into a short, concrete rollout that proves value quickly while protecting learners and staff.

A 90‑day plan to implement adaptive learning in artificial intelligence

Weeks 1–2: Define outcomes and constraints (proficiency targets, time saved, compliance)

Assemble a cross‑functional kickoff team (instructional lead, data owner, IT, assessment specialist, legal/compliance and two pilot teachers). Decide the pilot scope: cohort size, grade or course, and the single learning objective you’ll optimize first. Agree measurable success criteria (e.g., mastery rate uplift, time-on-task reduction, teacher time reclaimed) and the minimum effect size that justifies scale.

Document constraints up front: data access rules, retention limits, permitted vendors, regulatory controls and required parental/learner consent. Create a short decision checklist that ties any future trade-offs back to these constraints.

Inventory systems and data sources (LMS events, SIS roster, assessment records, content repositories). Define a minimal event schema: learner id, timestamp, activity type, item id, outcome, context tags. Where possible, use hashed identifiers and eliminate unnecessary PII.

Implement lightweight pipelines to export and validate sample streams into a secure staging area. Add basic quality checks (duplicate detection, missing timestamps, schema validation) and a dashboard showing data freshness and coverage for the pilot cohort.

Weeks 3–6: Map content to skills and difficulty; add metadata for adaptivity

Create or refine a content graph that links outcomes → skills → items → prerequisites. Tag each resource with a short metadata set: target skill, estimated difficulty, item format, estimated time, and alignment to curriculum standards.

Calibrate initial difficulty estimates using teacher ratings or a small diagnostic. Split item pools into practice, diagnostic, and mastery items and add exposure rules to avoid overuse. Keep metadata editable so teachers can correct mappings during the pilot.

Weeks 5–8: Choose the engine (student model, policy, copilots) and integrate pilot

Select a student model and policy approach that matches your risk tolerance and team capacity (examples: lightweight probability-based model, Bayesian tracing, or a reinforcement-learned policy). Choose whether to run models in the cloud or on a hosted, vendor-managed service.

Build the integration layer: API endpoints for event ingestion, real‑time scoring, and decisioning. Create a simple teacher dashboard and a student-facing pathway so humans can review and override recommendations. Run end-to-end tests with synthetic and anonymized data before enabling live traffic.

Weeks 8–12: Run an A/B pilot; monitor learning gains, time-on-task, fairness and drift

Launch a controlled pilot with randomized assignment or matched cohorts. Track pre-registered primary and secondary metrics daily and weekly. Monitor operational signals (latency, missing events), pedagogical signals (time on task, problem completion patterns) and equity signals (performance by subgroup, differential exposure to items).

Hold weekly review checkpoints with teachers and analysts. Use short feedback loops to tune thresholds, adjust content mapping, and fix data gaps. Predefine stopping and rollback criteria for both safety and lack of impact.

Governance: human-in-the-loop review, bias audits, incident playbooks, security hardening

Establish a standing governance meeting. Require human review for high‑stakes recommendations and create a bias‑audit schedule (initial audit at 30 days, follow-up at 90 days). Maintain model versioning, reproducible training logs, and an incident playbook that includes detection, communication, mitigation and rollback steps.

Harden operational security: least‑privilege access, encrypted data at rest and in transit, periodic penetration testing and a clear data-retention policy. Publish a short transparency note for families and staff explaining what signals are used and how decisions are made.

By the end of 90 days you should have a validated pilot, a reproducible integration pattern, and a governance framework that supports safe scale. With that foundation in place, you can move quickly from experimentation to launching targeted applications that deliver measurable value to learners and teachers.

Thank you for reading Diligize’s blog!
Are you looking for strategic advise?
Subscribe to our newsletter!

High‑ROI use cases you can launch now

Virtual Teacher Assistant: planning, grading, feedback—reduce burnout, raise consistency

A virtual teacher assistant automates routine work so teachers can focus on instruction. Start by automating a single repetitive workflow—for example, formative quiz generation, rubric-based grading, or draft feedback for common error patterns—then expand as trust and accuracy improve.

Pilot checklist: integrate with the LMS for roster and assignment access, surface recommended edits for teacher approval, log all automated actions for audit. Success metrics to monitor: teacher time reclaimed, turnaround time for feedback, and teacher satisfaction with suggested outputs.

Key risks and mitigations: avoid full automation of high‑stakes grading until validated; require human sign‑off on edge cases; keep an easy override and correction flow so teachers remain in control.

Virtual Student Assistant: AI tutoring, study plans, career nudges—measurable proficiency gains

Virtual student assistants deliver targeted practice, explainers, and personalized study plans that adapt to a learner’s demonstrated skills and engagement. Begin with a narrow subject area where content and assessment alignment is strong, and offer the assistant as an optional supplemental tutor.

Pilot checklist: map content to clear learning objectives, instrument short diagnostics to seed the model, and provide students and teachers with transparent progress summaries. Track learning gains, time-on-task, and student engagement as primary outcomes.

To keep adoption steady, design the assistant to complement classroom instruction rather than replace it, and surface actionable suggestions teachers can use during small-group sessions.

Virtual Research Assistant: literature triage, annotation, experiment summaries—do more with less

For universities and research labs, a virtual research assistant automates literature reviews, extracts structured findings from papers, and generates concise summaries of experimental results. Launch it first as an internal tool for grant teams or faculty reviewers to reduce screening overhead.

Pilot checklist: connect to trusted publication indexes, require human validation of extracted claims, and maintain provenance links back to original documents. Measure throughput improvements, time saved on screening tasks, and the accuracy of extracted summaries.

Governance note: preserve researcher control over final interpretation, and keep exportable audit trails for reproducibility and citation integrity.

Learner authenticity analysis: integrity signals to protect assessment value

Learner authenticity tools surface signals about test-taking context and unusual patterns that may indicate integrity concerns. Deploy them initially in low-to-medium stakes assessments to refine signal thresholds and reduce false positives.

Pilot checklist: define clear policies for how alerts are handled, ensure transparency with students about monitoring, and integrate human review before any disciplinary action. Monitor false positive rate, reviewer workload, and the impact on assessment validity.

Balance is critical: use signals to protect assessment quality while avoiding intrusive practices that undermine trust or disproportionately impact specific groups.

These four use cases share a common pattern: start small, instrument for measurement, build teacher and student trust through transparency, and iterate quickly. With practical pilots that prove learning impact and operational efficiency, teams are ready to formalize measurement and safety practices that make adaptive deployments sustainable and trustworthy.

Guardrails and measurement: make adaptation trustworthy

Privacy and cybersecurity by design: least data, local storage options, breach drills

Design privacy into every decision: only collect signals you need for the intended learning objective, document retention windows, and prefer hashed or pseudonymised identifiers where feasible. Where latency and policy allow, push scoring and personalization logic to the edge or local environments to limit PII exposure.

Operationalize security with simple, testable controls: role-based access, end-to-end encryption, vendor risk assessments, and an incident playbook that runs tabletop exercises at least once a year. Make consent and data-use explanations clear and accessible to students, families and staff so that trust is explicit, not assumed.

Fairness checks: subgroup performance, item exposure balance, explainable policies

Measure fairness continuously, not only at launch. Track model and outcome metrics disaggregated by relevant subgroups (e.g., proficiency bands, language background, or other protected attributes you are permitted to use) so you can detect differential impacts early.

Control content exposure by design: balance item rotations and preserve separate diagnostic and mastery pools to avoid over‑exposing specific items to particular groups. Combine automated alerts with human review for any flagged disparities and document remediation decisions so they are auditable.

Prioritize explainability for decisions that affect learners’ pathways or assessments. Even simple, human-readable justifications (“recommended extra practice on decimals because diagnostic shows 2/5 correct”) go a long way toward acceptance and accountability.

Success metrics that matter: mastery delta, retention, attendance, teacher hours saved, ROI

Define a small set of primary metrics tied to your stated goals — for example, change in mastery rate over a defined window — and a set of secondary operational indicators like retention, attendance, time-on-task and teacher time reclaimed. Keep the metric set minimal so the team focuses on what actually moves the needle.

Complement outcome metrics with leading indicators (engagement patterns, diagnostic recovery rates) that help you tune interventions quickly. Always report both relative gains and absolute levels so stakeholders understand practical significance, not just statistical significance.

Evidence workflow: pre‑register metrics, run staggered pilots, share results with stakeholders

Pre-register your evaluation plan before pilot launch: declare primary outcomes, sample sizes, randomization approach and decision rules. Pre-registration reduces researcher degrees of freedom and makes findings more credible to educators and funders.

Use staggered or randomized pilots to isolate causal effects, and set short review cycles to capture both pedagogical and technical drift. Share results in plain language and with reproducible artifacts (data schemas, versioned models, dashboards) so teachers, administrators and oversight groups can interpret findings and raise concerns.

Finally, treat measurement as part of the product. Build monitoring dashboards, automated alerts for data quality and fairness regressions, and a lightweight governance loop that ties evidence to operational decisions — deploy, measure, iterate, and institutionalize what works.

Machine learning for customer segmentation: turn clusters into revenue fast

Everyone talks about “building clusters,” but few teams talk about what comes next: turning those clusters into predictable revenue. If you’re staring at segmented charts and wondering how they should change the way your sales reps reach out, how your product suggests upgrades, or how marketing budgets should be spent — you’re not alone. Machine learning can make segmentation faster, richer, and more precise, but only if you design the work to be used by people and systems that actually sell, retain, and expand customers.

This piece is a no-nonsense guide to closing that gap. We’ll skip academic theory and focus on the practical steps that matter: how to pick the right segmentation approach for your business goal, what data you must collect and engineer, how to validate that clusters are stable and not just noise, and how to activate segments across CRM, ads, product, and support so the model actually influences revenue.

Expect concrete takeaways you can apply in the next 30–90 days: a simple decision framework for choosing between broad clusters and ultra-targeted micro‑segments, a checklist for building an operational data pipeline (identity resolution, leakage-safe splits, refresh cadence), and an activation playbook that covers syncs, uplift tests, and the essential metrics to watch. We’ll also share four ready-made segment blueprints you can adapt to B2B and B2C contexts — so you don’t have to start from scratch.

No heavy math required. This article is written for the practitioner who needs results: product and growth managers, marketers running ABM or lifecycle programs, and data teams who want their models to move revenue. Read on if you want segmentation that’s not just pretty charts, but a repeatable path to more closed deals, happier customers, and measurable lift.

Ready to turn clusters into cash? Let’s get practical.

Why machine learning for customer segmentation matters now

Buyers changed: 80% of research happens before sales, more stakeholders, longer cycles

“Buyers are independently researching solutions, completing up to 80% of the buying process before even engaging with a sales rep — forcing marketers and sellers to meet prospects earlier and with far more personalised, channel‑aware outreach.” B2B Sales & Marketing Challenges & AI-Powered Solutions — D-LAB research

That shift breaks traditional lead-generation rhythms: prospects arrive already informed, decisions involve 2–3x more stakeholders, and cycles stretch as teams evaluate multiple vendors. Machine learning turns this noise into signal—automatically grouping buyers by intent, behaviour and fit so GTM teams can engage the right contacts earlier with highly relevant messages.

Personalization or perish: 76% expect it; ABM rises as budgets tighten and competition spikes

Personalization is now table stakes—most buyers expect experiences tailored to their needs, and account-based marketing is expanding as buyers tighten budgets and vendors compete harder. ML makes scalable personalization possible by combining behavioural, transaction and firmographic signals to predict who’s ready to buy, which offer will convert, and where to invest limited budget for the biggest ROI.

Omnichannel reality: unify web, product, CRM, support, and third‑party intent to see the real journey

Buyers touch dozens of channels before converting. Without stitching web analytics, product usage, CRM records, support tickets and third‑party intent, segments are blind and brittle. Machine learning excels at fusing these heterogeneous signals—producing segments that reflect true buying stages and uncovering cross‑channel triggers you can action in marketing, sales and product.

The payoff: +50% revenue from AI sales agents, +25% market share from analytics‑led personalization

The business case is clear: ML-powered segmentation both improves efficiency and revenue. Automated qualification and personalised outreach (via AI sales agents) can cut manual effort and accelerate deals, while analytics-driven personalization boosts conversion and share. When segments are validated and operationalised across CRM, CDP and product, companies capture faster closes, higher average deal sizes and measurable lift at scale.

All of this makes segmentation not just a data exercise but an urgent GTM lever: the next step is choosing the segmentation approach and model that map directly to your retention, deal-volume and expansion goals—so you can move from clustered insights to measurable revenue fast.

Choose the right segmentation approach for your outcome

Start with the goal: retention, deal volume, deal size, or market entry

Begin by naming the business outcome you must move. Different objectives demand different segment definitions and success metrics: retention focuses on health signals and lifetime value; deal volume needs funnel-stage propensity and lead scoring; deal size prioritises upsell signals and product affinity; market entry emphasises firmographic fit and competitive intent. Lock the metric, time horizon and target lift before you touch models—segments must be judged by business impact, not clustering purity alone.

Data you’ll need: RFM, behavior and usage, firmographic/technographic, intent signals, sentiment and support

Map the minimum viable feature set for your goal. Typical inputs include recency/frequency/monetary (RFM), product usage and event streams, company size/industry/tech stack for B2B, third‑party intent and search signals, and qualitative feedback from support or surveys. Prioritise identity resolution so signals from web, product, CRM and support stitch to the same customer or account—garbage in will always mean noisy segments out.

Model menu: K‑Means/GMM for baselines, spectral/ensemble for complex shapes, DBSCAN for noise/outliers

Pick models to match data geometry and operational constraints. K‑Means and Gaussian Mixture Models are fast, interpretable baselines for dense numeric features. DBSCAN or HDBSCAN handle irregular, noisy clusters and identify outliers. Spectral or manifold-based methods reveal structure when clusters sit on nonlinear manifolds. Ensembles combine algorithms to improve robustness. Always pair model choice with feature treatment: scaling, categorical encoding, and dimensionality reduction change which model performs best.

Go beyond clusters: CLV/propensity models, sequence models for journeys, text embeddings for feedback and notes

Clustering groups similar users; predictive models forecast value or behaviour. Add CLV or propensity-to-buy models to rank segments by expected revenue. Use sequence models (Markov models, RNN/transformer variants) to map likely customer journeys and identify transitional cohorts. Convert free text—support tickets, sales notes, NPS comments—into embeddings to enrich segment profiles and reveal sentiment-driven cohorts not visible in transactional data.

ABM micro‑segments vs broad clusters: when to go narrow and personalized vs scalable and simple

Decide whether to invest in micro‑segmentation or keep segments coarse. Narrow ABM-style micro‑segments make sense when account value justifies bespoke content and human effort. Broad clusters win when you must scale personalization across many users with limited GTM bandwidth. A pragmatic hybrid is common: route accounts into broad clusters for automated plays and elevate high-value targets into micro‑segments for bespoke, high-touch campaigns.

Whichever approach you choose, build evaluation gates up front—business-friendly names, holdout tests to measure lift, and operational constraints for activation. That foundation determines whether segments become repeatable GTM levers or one‑off analytics artifacts; next, you’ll need the plumbing and validation practices that make those segments reliable and deployable across your systems.

Build the data pipeline and validation that make segments usable

Unify and engineer: identity resolution, session stitching, key features, leakage‑safe splits

Start by creating a single source of truth: resolve identities across web, product, CRM and support so every event maps to the correct user or account. Stitch sessions into ordered event streams and materialise canonical features in a feature store with clear contracts (names, types, freshness). Design your train/validation/test splits to be leakage‑safe—time‑based or user/account‑level holdouts are essential so your clustering and downstream models are validated against realistic future signals.

Preprocess well: outlier handling, scaling, seasonality, sparse categorical encoding

Preprocessing determines whether clusters reflect signal or noise. Handle outliers and missingness explicitly, choose scaling or normalization appropriate to distance metrics, and add seasonality or rolling aggregates for time‑based behaviour. Encode high‑cardinality categorical fields with embeddings or target encoding, and keep sparse representations for features used in real‑time scoring. Document transforms and store transformation recipes alongside features to guarantee parity between training and production.

Pick K and prove it: elbow and silhouette, stability via bootstraps, business naming and lift checks

Treat cluster count as a hypothesis, not a hyperparameter to be tuned blindly. Use elbow and silhouette plots for initial guidance, then stress‑test clusters with bootstrap stability checks and alternative algorithms. Critically, translate clusters into business‑friendly names and run lift checks against held‑out cohorts—measure conversion, churn or revenue lift in controlled holdouts so segments are justified by GTM impact, not only internal metrics of cohesion.

Governance: refresh cadence, drift monitoring, versioning, and feedback loops from GTM teams

Operational segments need lifecycle rules. Define a refresh cadence based on signal half‑life (daily for intent, weekly/monthly for behaviour), implement drift detectors for feature distributions and cluster assignments, and version both data and models so you can trace changes. Create lightweight feedback channels with sales, CS and marketing so frontline teams can report mismatches and suggest re‑naming or regrouping—use that feedback to prioritise retrains and schema changes.

“Protecting customer data and following frameworks such as ISO 27002, SOC 2 and NIST matters: the average cost of a data breach in 2023 was $4.24M, and GDPR fines can reach up to 4% of annual revenue — both meaningful risks to revenue and valuation.” Deal Preparation Technologies to Enhance Valuation of New Portfolio Companies — D-LAB research

Operational steps: minimise PII in feature stores (use hashed or tokenised identifiers), surface consent and processing flags for each record, and bake access controls, encryption and audit logging into pipelines. Treat compliance as part of your SLAs—security reviews, penetration tests and framework alignment should be a gating criterion for any segment rollout.

When identity, feature engineering, validation tests and governance are in place, segments stop being one‑off analyses and become repeatable, trusted inputs for marketing, sales and product—ready to be activated, tested and measured across your revenue stack.

Thank you for reading Diligize’s blog!
Are you looking for strategic advise?
Subscribe to our newsletter!

From model to money: activation playbook for B2B and B2C

90‑day recipe: feature store → clustering/propensity → segment profiling → uplift test → rollout

Run a tight 90‑day cadence: week 0–2 build the feature store and identity joins; week 3–6 run clustering and propensity models; week 7–8 profile segments into actionable plays and creative; week 9–12 run controlled uplift tests; and weeks 13+ roll out winners with a staged ramp. Keep the scope narrow for the first sprint (one product line or region), instrument every touchpoint, and lock a clear success metric for the pilot—NRR, incremental revenue or conversion rate—so decisions are evidence‑driven.

Activate everywhere: CRM/CDP sync, ad platforms, website personalization, product and pricing engines

Make segments operational by wiring them into systems that touch buyers. Sync segment membership to CRM and CDP for sales and marketing workflows, push audiences to ad platforms and DSPs, and feed personalization engines on the website and in‑product. Surface segments inside quoting and pricing engines so sellers see recommended offers, and connect to email and messaging tools so creative can be auto‑tailored. Use real‑time vs batch syncs intentionally: high‑intent signals need low latency; behavioral cohorts can update less frequently.

AI‑powered moves: AI sales agents, hyper‑personalized content, recommendation engines, dynamic pricing, CS alerts

Layer AI into activation where it scales personalization and qualification. Use AI sales agents to augment qualification, generate tailored outreach, and auto‑populate CRM notes; deploy GenAI templates for hyper‑personalized landing pages and ad copy; and power product recommendations and dynamic pricing from segment signals. When automating outreach or pricing, start with guardrails and human review to avoid errors and brand risk.

“AI sales agents and related automation have been shown to materially move revenue and efficiency — studies and vendor outcomes cite up to ~50% increases in revenue and ~40% reductions in sales cycle time when AI augments qualification and CRM workflows.” B2B Sales & Marketing Challenges & AI-Powered Solutions — D-LAB research

Measure what matters: NRR, churn, LTV, AOV, close rates; run holdouts and segment‑level lift dashboards

Design experiments with clear holdouts: persist a control group at the account or user level and run uplift tests rather than before‑after comparisons. Track segment KPIs that map to business goals—Net Revenue Retention and churn for retention plays, LTV and AOV for expansion and pricing, close rate and sales cycle length for acquisition plays. Build segment‑level lift dashboards with cohort comparisons, confidence intervals and cost-per-lift so you can prioritise and iterate.

Operational tips: start with one high‑impact channel, automate routing rules so GTM teams receive prescriptive actions, and document playbooks (audience, offer, creative, CTA, timing, KPI). Use staged rollouts, watch carryover effects between segments, and keep a feedback loop from sales and CS to refine segment definitions. With activation pipelines and strong measurement in place, you can move rapidly from model outputs to revenue impact—next, we’ll look at concrete segment examples and the kinds of uplifts you should expect when these playbooks are applied consistently.

Four segment blueprints and the impact you can expect

In‑market intent segment: external research signals + firmographic fit → +32% close rate, shorter cycles

Who they are: accounts or users showing external intent (third‑party research, competitor comparisons, event attendance) and matching your ideal firmographic/technographic profile.

Plays: accelerate outreach with high‑personalisation (tailored assets, intent‑triggered SDR handoffs), run accelerated demo and pricing tracks, and prioritise these accounts in ad buys and ABM campaigns.

Expected impact: markedly higher close rates and shorter sales cycles versus baseline—measure via holdout groups to validate lift.

High‑CLV expansion segment: product usage depth + recency → +10‑15% revenue via targeted cross‑sell

Who they are: customers with deep, recent product usage and clear adoption signals—power users, multi‑module adopters, or accounts with frequent feature engagement.

Plays: personalised expansion plays driven by usage analytics (timed in‑product nudges, tailored package offers, success‑led outreach), plus recommendation engines for complementary products.

Expected impact: meaningful revenue uplift through cross‑sell and upsell when offers are timed to usage moments and delivered via in‑product and CS channels.

At‑risk churn cohort: negative sentiment + support spikes → −30% churn with proactive success plays

Who they are: customers showing falling engagement, rising support volume, negative sentiment in tickets or NPS, or downgrading behaviours.

Plays: trigger rapid CS interventions (health checks, tailored remediation playbooks, success manager escalation), offer targeted incentives or feature enablement, and run personalised win‑back experiments for recently lapsed users.

Expected impact: proactive, data‑driven success plays can substantially reduce churn; track retention lift with cohort holdouts and measure changes in LTV.

Price‑sensitive opportunists: discount responsiveness + value perception → up to +30% AOV via dynamic pricing

Who they are: buyers who demonstrate sensitivity to price and promotional offers—coupon usage patterns, low initial AOV, or high responsiveness to limited‑time discounts.

Plays: segment‑aware pricing and bundling, targeted promotions that preserve margin (frequency caps, personalized bundles), and A/B tests powered by dynamic pricing engines to optimise offers per cohort.

Expected impact: higher average order value and conversion when pricing is personalised to willingness‑to‑pay—measure incremental revenue per segment and monitor margin impact.

These blueprints are practical starting points: identify each cohort with clear rules, validate with randomized holdouts, and prioritise plays by addressable revenue and ease of activation. With measured experiments and tight operational handoffs, clusters become repeatable revenue levers rather than one‑off analyses.

XGBoost machine learning: fast accuracy, clear decisions, real ROI

If you work with business problems — churn, pricing, recommendations, or uptime — you want models that are fast to train, sharp in accuracy, and clear about why they make a decision. XGBoost is one of those pragmatic tools: it’s a gradient-boosted tree method that often gets you from messy tabular data to a reliable, explainable model without months of engineering.

This post walks you through the practical side of XGBoost: when it outperforms other approaches, the small set of knobs that drive most of the gains, real-world use cases that directly move revenue and costs, and the deployment and monitoring practices that keep results stable. By the end you’ll have a 30‑day plan to run a focused pilot and measure real ROI — not just a fancy dashboard.

  • When to use it: a quick guide to picking XGBoost over neural nets, random forests, or linear models.
  • Train smarter: the 20% of hyperparameters and data prep that produce 80% of the improvement.
  • From model to money: concrete use cases (churn, pricing, maintenance, fraud) and how to translate lift into dollars.
  • Deploy with confidence: explainability, governance, and simple monitoring patterns you can adopt this month.
  • Your 30‑day roadmap: week-by-week tasks to get a pilot from data to live test.

Note: I can add up-to-date statistics and links to papers, benchmarks, and case studies if you want — tell me which kinds of evidence (Kaggle wins, business lift percentages, latency/throughput benchmarks) you’d like and I’ll pull sources and backlinks into the intro.

What XGBoost is—and when it beats other models

The core idea: gradient-boosted decision trees that fix the last model’s mistakes

XGBoost is an implementation of gradient-boosted decision trees (GBDT): it builds an ensemble of shallow decision trees sequentially, and each new tree is trained to predict the residual errors left by the current ensemble. That greedy, stagewise procedure turns many weak learners into a single strong predictor that captures nonlinearities and feature interactions without manual feature engineering. For practical work this means XGBoost often reaches high accuracy quickly on structured, tabular problems while remaining interpretable at the feature level via per-tree contributions and post-hoc tools like SHAP.

For a technical primer and the original system description, see the XGBoost paper and documentation: https://arxiv.org/abs/1603.02754 and https://xgboost.readthedocs.io/en/stable/.

Why “eXtreme”: regularization, sparsity-aware splits, histogram/approximate search, parallelism, GPU

“eXtreme” isn’t marketing — it describes practical engineering choices that make XGBoost both fast and robust at scale. Key elements include explicit regularization terms (L1/L2) on tree leaf weights to reduce overfitting, algorithms that handle sparse inputs and missing values efficiently, histogram-based or approximate split finding to cut memory and compute, and implementations that exploit multicore CPU parallelism and GPUs for large datasets. Those optimizations let XGBoost train deeper ensembles in less time and with better generalization than many naive boosting implementations.

Read the implementation notes and performance sections in XGBoost’s docs and repository: https://github.com/dmlc/xgboost and https://xgboost.readthedocs.io/en/stable/.

When to pick XGBoost vs. Random Forest, neural nets, linear models

Pick XGBoost when you have tabular data where nonlinearity and feature interactions matter and you need a well‑performing, production-ready model fast. Compared to a Random Forest, XGBoost’s boosting strategy usually yields higher predictive accuracy (at the cost of more careful tuning); compared to neural networks, boosted trees typically win on small-to-medium sized structured datasets and require far less feature engineering; compared to linear models, XGBoost captures complex relationships that linear models cannot, though linear models remain preferable when interpretability, extreme sparsity, or very high-dimensional linear structure dominate.

In short: use linear models for quick, interpretable baselines; Random Forest for quick, robust bagging baselines; XGBoost when you want state-of-the-art tabular performance with explainability options; and neural nets when you have massive data or unstructured inputs (images, text, audio). Practical comparisons and community guidance are discussed broadly in model-comparison writeups — see a common comparator guide: https://www.analyticsvidhya.com/ and the XGBoost docs for tradeoffs: https://xgboost.readthedocs.io/en/stable/.

XGBoost vs. LightGBM vs. CatBoost: quick rules of thumb

Three widely used GBDT engines each have pragmatic strengths. LightGBM (Microsoft) optimizes speed and memory with a leaf-wise growth strategy and very fast histogram algorithms, making it a go-to for very large datasets. CatBoost (Yandex) focuses on robust handling of categorical features and reduced target-leakage through ordered boosting, which can simplify pipelines when many high-cardinality categoricals are present. XGBoost offers a mature, well-documented, and stable balance of accuracy, regularization, and production features; it’s often the default choice when you want reliability and extensive community tools.

If you need a short decision rule: choose CatBoost when you want native categorical handling with minimal encoding, LightGBM when training speed on huge datasets is the priority, and XGBoost when you need a balanced, battle-tested system with strong regularization controls. See the respective projects for details: https://github.com/microsoft/LightGBM, https://catboost.ai/, https://github.com/dmlc/xgboost.

Data it loves: tabular features, missing values, mixed scales

XGBoost thrives on conventional business datasets: numeric and categorical features converted to numeric encodings, mixed ranges and scales, moderate feature counts (hundreds to low thousands), and datasets with some missingness. It has built-in handling for missing values (routing missing entries to a learned default direction), tolerates sparse inputs, and does not require intensive feature scaling. Where features are raw text or images, tree ensembles are usually not the first choice unless you featurize those inputs into tabular signals first.

For implementation notes on missing-value behavior and sparse inputs, consult the docs: https://xgboost.readthedocs.io/en/stable/faq.html#how-does-xgboost-handle-missing-values.

With a clear sense of what XGBoost does best and when simpler or heavier alternatives are more appropriate, the next step is operational: focus on the handful of data and training settings that deliver most of the model’s real-world gains.

Train smarter: the 20% of settings that drive 80% of performance

Data prep: DMatrix, handling missing values, categorical encoding options

Start by loading data into XGBoost’s optimized DMatrix (faster I/O, lighter memory during training) and keep sparse inputs as sparse matrices where possible. XGBoost can learn a default direction for missing values, so you don’t always need to impute — but check that your missingness is not informative (otherwise add a missing flag). For categorical features choose the simplest encoding that preserves signal: one-hot for low-cardinality, frequency/target encoding or hashing for high-cardinality. If you have many native categoricals and want to avoid manual encoding, consider CatBoost for comparison (https://catboost.ai/). For DMatrix and input notes see the XGBoost docs (https://xgboost.readthedocs.io/en/stable/).

Objective and metrics: binary:logistic with AUC-PR for imbalance; reg:squarederror for forecasting

Pick the objective that matches your business loss: binary:logistic for binary classification, reg:squarederror for regression/forecasting. For imbalanced classification prefer precision‑recall metrics (AUC‑PR) over ROC AUC when the positive class is rare; they better reflect business impact for rare-event detection (precision/recall guidance: https://scikit-learn.org/stable/modules/model_evaluation.html#precision-recall-f1-score). Configure evaluation metrics in training so early stopping uses the metric you care about.

Hyperparameters that matter most: learning_rate, n_estimators with early stopping, max_depth/max_leaves

Focus on three knobs first. Set learning_rate (eta) modestly — common starts are 0.1 or 0.05 — and then control model size with n_estimators plus early stopping (monitor a holdout). Use early stopping to avoid wasting cycles and to pick the best iteration. For tree complexity tune max_depth (shallow trees, 3–8, reduce overfitting) or max_leaves where supported by the tree method; deeper/leafier trees capture interactions but need stronger regularization or lower learning_rate. These parameters typically deliver the largest single boosts in real-world performance.

Generalization levers: subsample, colsample_bytree, lambda/alpha, gamma

Use sample-based regularizers to reduce overfitting: subsample (row sampling) and colsample_bytree (feature sampling per tree) are powerful and simple — try values like 0.6–0.9 if overfitting. Add L2 (reg_lambda) and L1 (reg_alpha) on leaf weights to tame variance, and set gamma (min_split_loss) to require a minimum gain for new splits. These controls are often more effective than aggressive pruning of tree depth alone. Parameter reference: https://xgboost.readthedocs.io/en/stable/parameter.html.

Class imbalance: scale_pos_weight and sampling

For skewed classes, two pragmatic options: adjust scale_pos_weight to roughly (num_negative / num_positive) as a starting heuristic, or use stratified sampling / up/down-sampling to balance training. Which is better depends on data size and rarity — for very rare positives tuning scale_pos_weight with your metric (AUC‑PR) often works well; for moderate imbalance, careful stratified CV plus class weighting is safer.

Speed tips: GPU training (RAPIDS), memory limits, approximate vs exact

When datasets are large, use the histogram-based algorithms and GPU acceleration (tree_method=gpu_hist) to cut training time substantially. RAPIDS ecosystem and XGBoost GPU support speed up preprocessing and training for big tabular workloads (https://rapids.ai/ and XGBoost GPU docs https://xgboost.readthedocs.io/en/stable/gpu/index.html). Prefer approximate/hist split-finding for large data; exact split-finding is only reasonable for small datasets because it is much slower and memory-hungry.

Reliable validation: K-fold CV and leakage checks

Validate with the appropriate CV scheme: stratified K-fold for imbalanced classification, group K-fold when records are correlated by entity, and time-based splits for forecasting or any temporal signal. Always inspect features for leakage (derived from future labels, duplicated IDs, or aggregated target information). Use cross-validation to estimate variance and to drive early stopping; prefer multiple repeats or nested tuning when hyperparameter selection directly targets the held-out metric. Scikit-learn’s cross-validation guide is a good reference: https://scikit-learn.org/stable/modules/cross_validation.html.

Apply these priorities in sequence — clean DMatrix inputs, choose the right objective/metric, tune learning_rate with early stopping and max_depth, then apply sampling and regularization — and you’ll capture most of XGBoost’s practical upside without exhaustive grid searches. With a well-tuned, validated model and clear metrics you’ll be ready to map predictions to concrete business outcomes and measure the revenue or cost impact they deliver.

From model to money: XGBoost use cases that move the P&L

Customer retention and sentiment: predict churn, route save offers, +10% NRR; -30% churn; +20% revenue from feedback

XGBoost is a natural fit for churn and customer‑health scoring because it handles heterogeneous tabular signals (usage, support logs, billing events, NPS) and exposes feature importance for actioning saves. Score customers for churn risk, attach a predicted churn window and uplift estimate, then route high-value saves into a prioritized playbook (discount, outreach, tailored product). Use SHAP explanations to show sales/CS why an account is at risk and which interventions matter most — that trust accelerates execution and adoption.

“Customer retention: GenAI analytics & success platforms increase LTV, reduce churn (−30%), and increase revenue (+20%); GenAI call-centre assistants boost upselling and cross-selling (+15%) and lift customer satisfaction (+25%).” Portfolio Company Exit Preparation Technologies to Enhance Valuation. — D-LAB research

AI sales workflows: lead scoring and intent signals → +32% close rate, -40% sales cycle

Use XGBoost for lead-scoring models that combine firmographic, behavioral and intent signals to rank outreach priority. Train separate models for propensity-to-engage and propensity-to-close to tailor cadence and offers. Embed scores into CRM to automate route-to-owner, escalation rules, and A/B experiments for messaging — small increases in conversion and cycle time compound into large revenue gains.

Dynamic pricing: per-segment price recommendations → 10–15% revenue lift, 2–5x profit gains

For dynamic and segmented pricing, XGBoost captures nonlinear price elasticity across customer segments and inventory states using historical transactions, competitor price feeds and temporal demand features. Combine predicted conversion probability with margin models to compute expected-value-optimal prices per segment or deal. Productionize with canary releases and guardrails (min/max price bands).

“Dynamic pricing and recommendation engines can drive a 10–15% revenue increase and 2–5x profit gains by matching price to segment and demand in real time.” Portfolio Company Exit Preparation Technologies to Enhance Valuation. — D-LAB research

Recommendations: next-product-to-buy for B2B/B2C → +25–30% AOV, repeat purchase uplift

XGBoost works well as the ranking or candidate-scoring layer in hybrid recommenders: score candidate SKUs using recency/frequency/monetary features, session signals and product metadata, then re-rank by predicted incremental revenue or likelihood of cross-sell. Because trees handle sparse and mixed-scale inputs, they make feature engineering simpler and produce explanations that product teams can validate.

Predictive maintenance: failure risk ranking → -50% downtime, +20–30% asset life

For equipment health, XGBoost ingests sensor aggregates, maintenance logs, operating regimes and environmental context to produce failure-risk ranks and remaining‑useful‑life estimates. The model’s explainability enables maintenance planners to prioritize high‑impact interventions and to perform cost/benefit trade-offs for spare ordering and shift scheduling.

“Predictive maintenance and lights‑out factory approaches have delivered up to a 50% reduction in unplanned downtime and a 20–30% increase in machine lifetime, improving throughput and asset ROI.” Portfolio Company Exit Preparation Technologies to Enhance Valuation. — D-LAB research

Supply chain and inventory: demand/supplier risk scores → -40% disruptions, -25% costs

Score SKU‑region demand and supplier reliability using XGBoost models built on orders, lead times, supplier KPIs and macro indicators. Use predicted demand volatility and supplier risk to set safety stock, reroute orders, or trigger secondary suppliers. The result: fewer stockouts, lower expedited freight, and measurable working-capital improvements.

Fraud and cybersecurity risk scoring: prioritize alerts; align with ISO 27002, SOC 2, NIST

Use XGBoost to rank alerts by business impact probability — combining telemetry, user behavior, device signals and historical incidents — so security teams work on the highest‑value incidents first. Integrate model outputs with compliance and logging workflows to support auditability and incident response playbooks and align with cybersecurity due diligence.

“IP & data protection frameworks (ISO 27002, SOC 2, NIST) materially de-risk investments — average data breach cost was $4.24M (2023) and GDPR fines can reach up to 4% of annual revenue — so integrating rigorous controls with risk scoring is business-critical.” Portfolio Company Exit Preparation Technologies to Enhance Valuation. — D-LAB research

Across these examples the pattern is the same: use XGBoost to turn operational signals into prioritized actions that the business can execute, measure the lift with clear metrics, and iterate. Once predictions reliably move a KPI, the next focus is operational safety and explainability so stakeholders trust automated decisions and monitoring catches drift.

Thank you for reading Diligize’s blog!
Are you looking for strategic advise?
Subscribe to our newsletter!

Deploy with confidence: explainability, governance, and monitoring

Explainability your operators trust: SHAP values for features and decisions

Make explanations first-class: expose both global feature importance and per-decision attributions so product, sales and ops teams can see why the model recommended an action. Use SHAP-style additive explanations for tree ensembles to answer “which features drove this score?” and present those answers in business language (e.g., “high usage decline → churn risk”).

Operationalize explanations: include an explanation payload with each prediction, log the top contributing features for every decision, and surface those in the UI used by reviewers. That preserves context for human overrides, speeds troubleshooting and builds trust faster than opaque scores alone.

Data protection by design: minimize PII, access controls, audit logs

Design your pipelines so models never need unnecessary PII. Tokenize or hash identifiers where possible and only join sensitive attributes in secure, auditable environments. Limit access with role-based controls: separate model developers, reviewers and production engineers so each role has the minimum privileges required.

Keep immutable audit logs of model versions, training datasets, feature definitions and decision outcomes. Audit trails are essential for investigations, regulatory review and demonstrating that model changes follow an approved process.

Model health: drift detection, data quality checks, retraining cadence

Monitor inputs, predictions and business outcomes continuously. Track simple signals first — feature distributions, prediction-score histogram, and the metric you care about — then add targeted checks where issues actually occur. Alert on distribution shifts and missing buckets so data ops can triage upstream problems before models break.

Tie retraining cadence to observed change, not an arbitrary calendar. Use automated drift triggers to flag when the model needs a new training run and require human review before promotion. Maintain a model registry with clear metadata (training data snapshot, hyperparameters, evaluation metrics) so teams can roll back to known-good versions quickly.

Serving patterns: batch vs. real-time, fallbacks, canary releases

Match serving architecture to business needs. Use batch scoring for large‑scale re-ranking, daily decisions and offline reports; use real‑time inference for interactive flows or time‑sensitive interventions. Implement defensive patterns for both: input validation, provenance headers, and lightweight sanity checks at inference time.

Deploy new models gradually via canary releases or traffic-splitting and compare business metrics and system signals before a full rollout. Always have conservative fallbacks — a simpler baseline model or rule — so business processes remain protected if the new model underperforms or telemetry fails.

Putting these practices in place — clear explanations, strict data governance, continuous health monitoring and cautious rollout patterns — reduces operational risk and accelerates adoption. With those foundations established, you can move quickly from experiments and pilots to a short, structured roadmap that delivers measurable wins to the business.

A 30‑day roadmap to your first XGBoost win

Week 1: pick a value driver (churn, pricing, maintenance) and set a success metric

Day 1–2: Convene a short working group (product, data, ops, one business sponsor). Pick one clear value driver with an owner and a single success metric (e.g., churn rate reduction, incremental revenue per offer, downtime minutes avoided).

Day 3–5: Define the decision the model will drive, the action(s) tied to predicted outcomes, the target population and a simple ROI hypothesis (how a 1–5% lift maps to dollars or cost saved). Confirm data access and preliminary feasibility (sample size, label availability, signal cadence).

Week 2: data audit, baseline, and quick CV with early stopping

Day 8–10: Run a focused data audit: schema, missingness patterns, duplicates, label leakage risks and availability windows. Freeze a feature list and snapshot the dataset for reproducibility.

Day 11–14: Build a quick baseline model using XGBoost defaults (DMatrix inputs, binary:logistic or reg:squarederror as appropriate). Use stratified/time-aware K-fold CV and early stopping to get a robust, fast estimate of achievable performance. Record baseline metrics and a one-page baseline summary for stakeholders.

Week 3: iterate hyperparameters, add SHAP, run backtests

Day 15–18: Run targeted hyperparameter sweeps for the 20% of knobs that matter: learning_rate + n_estimators with early stopping, max_depth, subsample, colsample_bytree, and a simple reg_lambda/reg_alpha scan. Prefer Bayesian or successive-halving search to brute force.

Day 19–21: Add explainability (SHAP summaries and example-level attributions) and produce a short report that maps model drivers to business logic. Run historical backtests or simulated decisioning to estimate operational impact and false-positive / false-negative tradeoffs.

Week 4: pilot in workflow, A/B test, measure lift, plan hardening

Day 22–25: Integrate the score into the live workflow with a safe architecture: canary or traffic‑split, clear fallbacks (baseline rule), and logging of inputs + predictions + SHAP explanation. Keep human review in the loop for high‑impact actions.

Day 26–30: Run an A/B or holdout test long enough to detect the pre-defined KPI change. Measure both model performance and business KPIs, capture qualitative feedback from operators, and produce a post‑pilot readout with recommended next steps: production hardening, monitoring thresholds, retraining cadence, and a rollout plan.

Deliverables at the end of 30 days: a production‑ready scoring endpoint (or batch job), documented baseline vs. tuned model results, SHAP-backed explanation pack for stakeholders, an A/B test result with measured lift and a concrete rollout & monitoring checklist for hardening into full production.