READ MORE

Private Equity Value Creation Strategies: What Actually Moves Multiples Now

When I talk with fund managers and operators today, one theme keeps coming up: the old playbook — pile on leverage, wait for multiple expansion — doesn’t move the needle like it used to. Higher rates, tighter debt markets and more sophisticated buyers mean the margin for error is smaller. That doesn’t make value creation harder, it just changes what actually works.

This post walks through that new mix. We’ll look at the levers buyers reward now — operational improvement and digital execution, defendable IP and data posture, AI-driven top-line growth, and margin initiatives that reliably translate into EBITDA. You’ll also see why documenting the impact (clear KPIs, before/after evidence, and diligence-ready data) is no longer optional: it’s how you convert initiatives into a higher multiple at exit.

If you’re a GP, an operating partner, or a CFO preparing an exit, think of this as a practical map: less theory, more tactics that travel to valuation. Expect concrete examples of where multiple expansion still happens (niche market leaders, buy‑and‑build rollups, timing plays), and where it doesn’t — plus clear signals buyers look for around security, AI-enabled growth, and repeatable unit economics.

Read on to learn which moves actually shift buyer perception today, how to prioritize effort across portfolio companies, and how to prove the story to accelerate exits without relying on cheap debt or lucky timing.

From Leverage to Leadership: The Value Creation Mix Has Shifted

Private equity value creation has moved beyond the old playbook of loading deals with cheap debt and waiting for market tailwinds. Today the most reliable path to higher exit multiples combines prudent capital structures with hands‑on leadership, focused M&A, and relentless operational execution. Funds that balance financial engineering with true business transformation are the ones that actually move multiples in the current environment.

Leverage in a higher‑rate world: prudence beats max debt

When borrowing costs are elevated and refinancing windows are less certain, aggressive leverage has become a liability rather than a straightforward multiplier of returns. The smarter approach is to design capital structures that preserve optionality: modest leverage, covenant flexibility, and clear paths to deleveraging through cash generation or staged exits.

That shift changes sponsor behavior. Instead of relying on financial tailwinds, managers prioritize cash conversion, working capital discipline, and scenario planning. Hold‑period strategies increasingly emphasize resilience — ensuring the business can fund growth initiatives and weather macro swings without forcing distressed sales or dilutive financings.

Multiple expansion: niche focus, buy‑and‑build, and timing

Multiple expansion is no longer automatic; it must be earned. Buyers pay premiums for scarcity, defensibility, and predictable growth. That explains why niche leaders and well‑executed roll‑ups remain powerful levers: consolidating fragmented subsegments creates market share, pricing power, and a clearer strategic story for acquirers.

Timing and story matter. Targeting pockets where buyers value recurring revenue, regulatory approvals, or specialized domain expertise makes multiple expansion repeatable. Equally important is building a credible narrative—proof points on growth sustainability and margin leverage—that prospective acquirers can underwrite at exit.

Operational improvement and digital execution: the primary engine of returns

With leverage constrained and multiples earned, operational improvement has become the primary engine of value. That includes classic cost and margin work, but increasingly it’s about upgrading go‑to‑market, pricing, and product‑led growth through digital execution. Investments in pricing engines, CRM automation, and targeted sales enablement convert into higher deal sizes and better retention—two durable drivers of valuation.

Digital initiatives matter because they make improvements measurable and repeatable. When AI, analytics, and process automation are combined with leadership changes and clear KPIs, performance gains travel cleanly to EBITDA and create credible before/after evidence for buyers. The playbook now centers on rapid, data‑backed pilots that scale into company‑wide programs and on governance that locks in gains post‑rollout.

All three levers—prudent capital, focused consolidation, and deep operational work—are complementary. Prudent financing reduces downside, buy‑and‑build creates strategic optionality, and digital operational programs convert that optionality into verifiable improvements in earnings and growth. To sustain and monetize those gains, sponsors must also secure the business’s strategic assets and reduce execution risk—setting the stage for a discussion on protecting the core value drivers that buyers increasingly prize.

Defend the Core: IP and Data Protection That Expand Valuation

Monetize and defend IP to raise quality‑of‑earnings

Intellectual property is often the single biggest differentiator in a growth story — and when treated as a business asset it can lift both revenue quality and buyer confidence. Start with an IP audit: catalog patents, copyrights, trade secrets, customer datasets, and any proprietary models or processes. Ensure ownership is clean (assignments, inventor agreements, contractor work‑for‑hire) and eliminate encumbrances that kill deal certainty.

Next, convert protection into economics: build licensing models, embed differentiated features behind tiered pricing, or carve out standalone revenue streams for platform or data access. Buyers reward predictable, recurring, and defensible revenue; packaging IP as monetizable products or contractual advantages (exclusives, OEM agreements, preferred supplier terms) directly improves the quality of earnings that drives higher multiples.

SOC 2, ISO 27002, and NIST 2.0: the trust stack buyers expect

“The business case for frameworks is concrete: the average cost of a data breach in 2023 was $4.24M, GDPR fines can run up to 4% of annual revenue, and strong NIST/SOC/ISO posture can win deals — e.g., By Light secured a $59.4M DoD contract despite being $3M more expensive, largely attributed to its NIST implementation.” Deal Preparation Technologies to Enhance Valuation of New Portfolio Companies — D-LAB research

Frameworks are shorthand for risk reduction. SOC 2 communicates operational controls and privacy practices to commercial buyers; ISO 27002 (often via ISO 27001 certification) signals an audited ISMS and continual improvement; and NIST 2.0 demonstrates a government‑grade, risk‑based security posture. Together they reduce pricing discounts driven by perceived vendor risk and open doors to enterprise and public‑sector contracts.

Practical steps that move the needle: run a gap assessment against the chosen framework, prioritize high‑impact controls (identity, logging, backup and recovery, patching), and generate evidence early — policies, control matrices, incident logs, and an audit roadmap. For exits, a SOC 2 Type II report or an ISO certificate converts technical work into diligence artifacts that buyers can underwrite.

Cyber resilience that lowers risk and wins enterprise deals

Beyond certification, resilience is about operationalizing security so breaches, downtime, or third‑party failures no longer threaten valuation. Implement continuous monitoring, endpoint detection and response (EDR/MDR), and a tested incident response plan with regular tabletop exercises. Secure software development lifecycle (S‑SDLC) practices, encryption of sensitive data at rest and in transit, and least‑privilege identity controls make the business harder to breach and easier to vouch for in diligence.

Don’t forget third‑party risk: vendors and cloud providers should be contractually assessed and monitored, and key customer contracts should include security SLAs and audit rights. Transferable remedies — cyber insurance, escrow arrangements for critical code, and documented business continuity plans — reduce acquirer exposure and often translate to a smaller risk discount at exit.

Securing IP and hardening data controls is more than compliance: it’s a valuation multiplier because it converts intangible strengths into verifiable, diligence‑ready assets. With trust established and operational risk minimized, sponsors can focus on the next stage of value creation — converting defensibility into sustainable revenue growth through targeted go‑to‑market and product execution.

Grow the Top Line With AI: Retention, Deal Size, Deal Volume

Increase customer retention with sentiment analytics, GenAI CX, and success platforms

“AI-driven retention tools show measurable impact: sentiment analytics and success platforms can drive up to a 25% increase in market share and a 20% revenue uplift from acting on feedback; personalization boosts loyalty (71% of brands report improvement) and even a 5% lift in retention can increase profits by 25–95%. GenAI call‑center assistants have delivered ~20–25% CSAT gains, ~30% churn reduction and ~15% higher upsell rates.” Portfolio Company Exit Preparation Technologies to Enhance Valuation — D-LAB research

Start with signal consolidation: ingest product usage, support transcripts, NPS and transactional data into a unified analytics layer. That single source lets you detect at‑risk cohorts, automate targeted interventions, and measure lift. Layer GenAI into CX to surface next‑best actions in real time for agents and to automate personalized outreach at scale. Complement these with a customer success platform that operationalizes playbooks, automates renewal nudges, and turns reactive support into proactive growth.

Lift deal size with recommendation engines and dynamic pricing

“Recommendation engines and dynamic pricing materially move deal economics: product recommendations can deliver ~10–15% revenue increases and 25–30% higher cross‑sell conversion, while dynamic pricing has driven up to a 30% increase in average order value, 2–5x profit gains and documented case effects like a 25% revenue uplift in large deployments.” Portfolio Company Exit Preparation Technologies to Enhance Valuation — D-LAB research

Practical execution begins with a prioritized MVP: deploy a recommendation layer on high‑traffic touchpoints (cart, billing, post‑purchase) and a dynamic pricing pilot on a subset of SKUs or customer segments. Track incremental AOV and margin impact, then scale what sticks. Crucially, align incentives across product, sales and finance so uplift in deal economics translates into durable contracts and clearer unit economics for buyers.

Expand deal volume with AI sales agents and buyer‑intent data

Volume growth is a two‑part problem: pipeline coverage and conversion. AI sales agents automate discovery and qualification, freeing reps to focus on high‑value conversations; combined with buyer‑intent data they surface active prospects earlier in the funnel. That reduces wasted outreach, shortens cycle times, and increases qualified pipeline velocity.

Operationalize this by embedding intent signals into CRM workflows, automating personalized cadences for high‑propensity accounts, and instrumenting closed‑loop attribution so marketing and sales learn which plays scale. Focus first on segments with strong repeatability and measurable conversion lifts — those wins compound rapidly across the portfolio.

When retention, deal size and volume all move together, topline growth becomes predictable and investible — a narrative that acquirers reward. With revenue momentum in place, the natural next priority is converting those gains into sustainable margin expansion and demonstrable EBITDA improvements.

Thank you for reading Diligize’s blog!
Are you looking for strategic advise?
Subscribe to our newsletter!

Scale Efficiently: Margin Levers That Travel to EBITDA

Improving margins is the clearest, most durable way to grow enterprise value: cost savings that persist scale directly into EBITDA and become part of the story buyers can underwrite. The highest‑leverage programs combine better asset reliability, smarter inventory and sourcing, step‑change production automation, and workflow automation that reduces overhead without sacrificing growth.

Predictive maintenance and digital twins to raise uptime

Move from reactive repairs to condition‑based maintenance by instrumenting critical assets, building a clean telemetry pipeline, and layering analytics that predict failure modes. A digital twin lets teams simulate repairs and schedule interventions during low‑impact windows, turning expensive unplanned downtime into planned, low‑cost maintenance.

Start small with a prioritized asset class, validate predictive signals against historical outages, and integrate alerts into existing maintenance workflows. The objective is clear: increase throughput and reduce emergency work so production capacity converts directly into higher gross margin and lower maintenance spend.

Supply chain and inventory optimization to free cash and cut cost

Inventory is often working capital trapped by weak forecasting, broad safety stock policies, and opaque supplier performance. Tighten the loop with demand forecasting, SKU segmentation, and dynamic safety stock based on lead‑time variability. Rationalize suppliers where concentration delivers scale discounts and diversify where single‑source risk creates margin volatility.

Complement process changes with tooling: a single source of truth for inventory and shipments, automated replenishment rules, and scenario planning for supplier disruptions. The combined effect is fewer stockouts, lower carrying costs, and faster cash conversion—directly improving margins and balance‑sheet resilience.

Lights‑out and additive manufacturing for step‑change productivity

Full automation and additive techniques are not for every plant, but when applicable they deliver structural cost advantages: 24/7 operation, lower labor exposure, and reduced setup and tooling costs for complex, low‑volume parts. Use additive manufacturing to remove retooling steps and enable more localized, demand‑driven production.

Evaluate opportunities with a factory-by-factory lens: identify high‑variability processes, parts with expensive tooling, or production lines constrained by labor. Pilot cell automation and hybrid human‑robot workflows before scaling to protect cash and maximize learning.

Automate workflows with AI agents and co‑pilots

Administrative and knowledge‑work tasks compound as companies scale. Selective automation—RPA for structured tasks, AI agents and co‑pilots for decision support, and agents that orchestrate cross‑system processes—shrinks cycle times, lowers SG&A, and improves decision velocity.

Prioritize processes with high volume and manual effort, instrument outcomes, and embed human review where risk is material. Governance and change management are critical: measurable productivity gains require clear KPIs, training for teams, and maintenance of data quality so automation continues to deliver.

These margin levers are complementary: improved uptime raises available capacity, supply‑chain savings free capital to invest in automation, additive manufacturing reduces unit costs, and workflow automation shrinks overhead. Once executed, the next imperative is to translate those operational wins into verifiable metrics and diligence‑ready evidence so value creation survives scrutiny and converts into a premium at exit.

Prove It: Metrics, Evidence, and Exit Readiness

The KPI stack buyers pay for: NRR, CAC payback, AOV, churn, EBITDA margin

Buyers do not buy promises — they buy repeatable economics. That means a tight set of KPIs that explain growth quality, unit economics, and margin sustainability. Net revenue retention (NRR) shows how revenue evolves inside the installed base; CAC payback and customer acquisition cost explain how efficiently the business acquires growth; average order value (AOV) and churn measure commercial upside and retention risk; EBITDA margin demonstrates how topline growth translates into cash profits. Present these metrics with consistent definitions, a clear data lineage, and a cadence (monthly/quarterly) that matches how the business is run.

Important implementation notes: define each KPI unambiguously (what counts as revenue, how renewals/discounts are treated), tie KPIs to source systems so figures are auditable, and supply cohort‑level views so buyers can see lifecycle dynamics rather than surface aggregates.

Build a value creation bridge with before/after evidence

Claims about uplift need a bridge: documented initiatives, baseline metrics, the intervention, measured outcomes, and a forecast that conservatively rolls results forward. That means before/after comparisons, A/B or cohort tests where practical, and an attribution approach that isolates initiative impact from seasonality or external factors.

Translate operational work into dealable evidence: show the pilot design, control group results, roll‑out plan, and realized KPIs (revenue per account, margin per unit, etc.). Use visualizations — waterfalls, cohort retention curves, and unit‑economics bridges — to make the story easy to underwrite. Buyers reward verifiable, repeatable improvements that map directly into cash flow.

Diligence‑ready data rooms and a crisp exit narrative

A clean, well‑organized data room is a multiplier: it shortens diligence, reduces buyer skepticism, and preserves leverage. Structure the room around the story you want to sell — commercial traction, product defensibility, operational improvements — and include the raw datasets and queries that back every headline KPI. Common essentials are: historic P&Ls and working papers, KPI export files with data dictionaries, customer contracts and retention proof, product roadmaps and IP registers, compliance and security artifacts, and the value‑creation program documentation (workstreams, owners, timelines, pilots).

Beyond documents, craft a one‑page exit narrative that links the KPI deck to the competitive landscape and the go‑forward plan. Anticipate the top diligence questions and answer them preemptively with supporting evidence: sensitivity cases, downside mitigants, and key dependencies. When buyers can see the mechanics behind the numbers and the required next steps to protect upside, bids rise and timelines compress.

In sum, proving value is an evidence game. Standardize KPIs, build rigorous before/after proof for every major initiative, and make diligence effortless with organized data and a focused narrative. Done well, these steps lock operational improvements into the valuation conversation and convert execution wins into tangible premium at exit.


AIOps analytics: turn noisy IT/OT data into uptime, quality, and ROI

Imagine your operations team staring at hundreds of alerts every hour while a critical line in the plant stumbles, or your cloud bill spikes overnight and nobody knows which service caused it. That’s the reality of modern IT/OT environments: distributed systems, legacy controllers, edge sensors, and cloud services all produce mountains of logs, metrics, traces, events and change records — and most of it is noise. AIOps analytics is about turning that noisy stream into clear signals you can act on, so you get more uptime, better product quality, and measurable return on investment.

Put simply, AIOps analytics ingests diverse telemetry, correlates related events across IT and OT, and uses real‑time analytics plus historical machine learning to provide context. Instead of paging a person for every alert, it groups related alerts, points to the probable root cause, and — where safe — kicks off automated remediation or runbooks. That means fewer alert storms, faster mean time to repair, and fewer surprises during peak production.

Why now? Two reasons. First, hybrid and cloud-native architectures have grown so complex that traditional, manual operations don’t scale. Second, cost and sustainability pressures make downtime and waste unaffordable. The combination makes AIOps less of a “nice to have” and more of a practical necessity for teams that must keep equipment running, products within spec, and costs under control.

This article walks through what useful AIOps analytics actually does (not the hype), the capabilities that matter, how manufacturers capture value from predictive maintenance to energy optimization, and a practical reference architecture plus a 90‑day rollout plan you can follow. Read on if you want concrete ways to convert your noisy telemetry into predictable uptime, tighter quality control, and measurable ROI.

AIOps analytics, in plain language

What it does: ingest, correlate, and automate across logs, metrics, traces, and changes

AIOps platforms collect signals from everywhere your systems produce them: logs that record events, metrics that measure performance, traces that show request flows, and change records from deployments or configuration updates. They normalize and stitch these different signal types together so you can see a single incident as one story instead of dozens of disconnected alerts.

After ingesting data, AIOps correlates related happenings — for example, linking a spike in latency (metric) to a code deploy (change) and to error traces and logs from the same service. That correlation reduces noise, helps teams focus on the real problem, and drives automated responses: ticket creation, runbook execution, scaled rollbacks, or notifications to the right people with the right context.

How it works: real-time analytics plus historical ML for context

Think of AIOps as two layers working together. The first is real-time analytics: streaming rules, thresholds, and pattern detectors that surface incidents the moment they start. The second is historical intelligence: models trained on past behaviour that provide context — normal operating baselines, seasonal patterns, and known failure modes.

When those layers combine, the platform can do useful things automatically. It spots anomalies that deviate from learned baselines, explains why an anomaly likely occurred by pointing to correlated events and topology, and recommends or runs safe remediation steps. Importantly, good AIOps keeps a human-in-the-loop where needed, shows an explanation for any automated action, and logs both decisions and results for audit and improvement.

Why now: cloud complexity, hybrid estates, and cost pressure make manual ops untenable

Modern infrastructure is far more fragmented and dynamic than it used to be. Teams manage cloud services, on-prem systems, containers that appear and disappear, and OT devices in manufacturing or industrial networks — all of which generate vast, heterogeneous telemetry. The volume and velocity of that data outstrip what humans can reasonably monitor and correlate by hand.

At the same time, organizations face tighter budgets and higher expectations for uptime and product quality. That combination forces a shift from reactive firefighting to proactive, data-driven operations: detecting issues earlier, diagnosing root cause faster, and automating safe fixes so people can focus on higher-value work. AIOps is the toolkit that makes that shift practical.

With that foundation understood, it becomes easier to evaluate which platform features actually move the needle in production — and which are just marketing. Next we’ll dig into the specific capabilities to watch for when you compare solutions and build a rollout plan.

Capabilities that separate useful AIOps analytics from hype

Noise reduction and alert correlation that ends alert storms

True value starts with reducing noise. A useful AIOps solution groups related alerts into a single incident, suppresses duplicates, and surfaces a prioritized, actionable view. The goal is fewer interruptions for engineers and clearer triage paths for responders.

When evaluating vendors, look for multi-source correlation (logs, metrics, traces, events, and change feeds), fast streaming ingestion, and contextual enrichment so a single correlated incident contains relevant traces, recent deploys, and ownership information.

Root cause in minutes via dependency-aware event correlation and topology

Speedy diagnosis depends on causal context, not just pattern matching. Platforms that map service and infrastructure topology — and use it to score causal relationships — let teams move from symptom to root cause in minutes. That topology should include dynamic dependencies (containers, serverless, network paths) and static ones (databases, storage, OT equipment).

Practical features to demand: dependency-aware correlation, visual service maps with drill-downs to flows and traces, and explainable reasoning for any root-cause suggestion so operators can trust and validate automated findings.

Seasonality-aware anomaly detection and auto-baselining

Detection that treats every deviation as an incident creates more work, not less. The right AIOps models understand seasonality, business cycles, and operational baselines automatically, so anomalies are measured against realistic expectations instead of blunt thresholds.

Good solutions offer auto-baselining that adapts over time, configurable sensitivity for different signals and services, and the ability to attach business context (SLOs, peak windows) so alerts align with customer impact, not just metric variance.

Forecasting and capacity planning that prevent incidents

Beyond detection, mature platforms predict resource trends and failure likelihoods so teams can act before incidents occur. Forecasting should cover capacity (CPU, memory, IOPS), load patterns, and component degradation when possible, with what-if scenario analysis for planned changes.

Key capabilities include time-series forecasting with confidence intervals, workload simulation for deployments or traffic spikes, and automated recommendations (scale-up, reshard, reprovision) tied to cost and risk trade-offs.

Closed-loop runbooks with approvals, rollbacks, and ITSM integration

Automation that isn’t safe is dangerous. Effective AIOps ties detection and diagnosis to executable, auditable runbooks: safe playbooks that can be run automatically or after human approval, with built-in rollback, blast-radius controls, and integration with ITSM or CMMS for ticketing and change tracking.

Look for role-based approvals, canary and staged actions, complete audit trails, and bi-directional links to service tickets so automation improves MTTR without compromising governance or compliance.

Together, these capabilities distinguish platforms that actually reduce downtime and cost from those that mostly sell promise. Next, we’ll translate these technical features into concrete business outcomes and show where they most quickly pay back.

Where AIOps analytics unlocks value in manufacturing

Predictive + prescriptive maintenance: −50% unplanned downtime, −40% maintenance cost

AIOps turns raw machine telemetry—vibration, temperature, current, cycle counts, PLC/SCADA events—into failure forecasts and prioritized work. By combining streaming anomaly detection with historical failure patterns, platforms predict which asset will fail, why, and when to intervene with the least disruption.

When integrated with CMMS and maintenance workflows, those predictions become prescriptive actions: schedule a zone-level repair, order the right part, or run a controlled test. That reduces emergency repairs, shortens downtime windows, and shifts teams to planned, cost-effective maintenance.

“Automated asset maintenance solutions have delivered ~50% reductions in unplanned machine downtime and ~40% reductions in maintenance costs; implementations also report ~30% improvement in operational efficiency and a 20–30% increase in machine lifetime.” Manufacturing Industry Challenges & AI-Powered Solutions — D-LAB research

Process and quality optimization: −40% defects, +30% operational efficiency

Linking OT sensors, vision systems, SPC metrics, and process parameters gives AIOps a full view of production quality. Correlating small shifts in sensor patterns with downstream defects lets you detect process drift before scrap or rework increases.

Actions can be automated or recommended: adjust setpoints, slow a line, trigger local inspections, or route product through a different quality gate. The result is fewer defects, higher yield, and more consistent throughput without throwing more people at the problem.

Energy and sustainability analytics: −20% energy cost, ESG reporting by design

AIOps ingests energy meters, HVAC controls, machine utilization and production rate to optimize energy per unit. It finds inefficient sequences, detects leaks or waste, and suggests schedule changes that shift heavy loads to lower‑cost hours or balance thermal systems more efficiently.

Because AIOps ties operational metrics to production output, it can produce energy-per-unit KPIs and automated ESG reports—turning sustainability from a compliance checkbox into a measurable cost lever.

Supply chain sense-and-respond: −40% disruptions, −25% logistics costs

When factory status, inventory levels, and supplier events are correlated in real time, operations can react faster to upstream shocks. AIOps can surface signals — slowed cycle times, rising scrap, delayed inbound shipments — and kick off mitigation playbooks: reprioritise orders, reroute batches, or change packing/transport modes.

That tighter feedback loop lowers buffer inventory needs, reduces rush logistics, and preserves customer SLAs by turning raw telemetry into automated, auditable responses across OT, ERP, and logistics systems.

Digital twins and lights-out readiness: simulate before you automate (+30% output, 99.99% quality)

Digital twins let teams validate process changes, control strategies, or maintenance plans in a virtual replica fed by real telemetry. Coupled with AIOps, twins can run what-if scenarios (new shift patterns, increased throughput, component degradation) and surface risks before changes hit the shop floor.

“Lights-out factories and digital twins have been associated with ~99.99% quality rates and ~30% increases in productivity; digital twins additionally report 41–54% increases in profit margins and ~25% reductions in factory planning time.” Manufacturing Industry Disruptive Technologies — D-LAB research

These use cases are complementary: predictive maintenance keeps assets available, process optimization keeps quality high, energy analytics reduces cost per unit, supply‑chain sensing stabilizes flow, and digital twins let you scale automation safely. To capture these benefits in production you need a cleaned and connected data foundation, service and asset context, and safe automation policies—a practical blueprint and phased rollout make those elements real for plant teams.

Thank you for reading Diligize’s blog!
Are you looking for strategic advise?
Subscribe to our newsletter!

AIOps analytics reference architecture and a 90‑day rollout plan

Data foundation: connect observability, cloud events, ITSM, CMDB—and OT sources (SCADA, PLCs, historians)

Start with a single unified data plane that can accept high‑velocity telemetry (metrics, traces, logs), event streams (cloud events, deployment and change feeds), and OT signals (SCADA, PLCs, historians). The foundation should normalize and tag data at ingest so every signal can be tied to an asset, service, location, and owner.

Essential capabilities: streaming ingestion with backpressure handling, light-weight edge collectors for plant networks, secure connectors to ITSM and CMDB for enrichment, and consistent timestamping and identity resolution so cross-source correlation is reliable.

Service map and context: topology, dependencies, and change data for causality

Build a living service and asset map that represents runtime dependencies (services, networks, databases, PLCs) as well as change history (deploys, config edits, maintenance work). This map is the “lens” AIOps uses to reason about causality—so invest in automated discovery plus manual overrides for accurate ownership and critical-path flags.

Expose the map to operators via visual topology views and APIs so correlation engines, runbooks, and alerting can reference explicit dependency paths and change timelines when prioritizing and explaining findings.

Models and policies: baselines, anomaly rules, SLOs, and enrichment

Layer lightweight real-time rules (thresholds, rate-of-change) with historical models that auto-baseline expected behaviour for each signal and service. Complement detection with business-aware policies—SLOs, maintenance windows, and seasonality—that reduce false positives and align alerts to customer impact.

Policy management should live alongside model configuration, with versioning, testing environments, and labelled training data so models can be audited and iterated safely.

Automate the top 5 incidents: safe runbooks, approvals, and CMMS/Maximo integration

Identify the five incident types that drive most downtime or manual effort and implement closed-loop runbooks for them first. Each runbook should include: a playbook description, pre-checks, graded actions (observe → remediate → escalate), canary stages, rollback steps, and explicit approval gates.

Integrate runbooks with ITSM/CMMS so automation creates or updates tickets, attaches evidence, and records outcomes. Enforce role-based approvals and blast-radius controls so automation reduces mean time to repair without exposing the plant to unsafe actions.

Prove ROI: track MTTR, ticket volume, downtime, OEE, and energy per unit

Define a compact set of success metrics before you start and collect baseline values. Useful KPIs include MTTR, alert/ticket volume, incident frequency, production downtime, OEE (or equivalent throughput measures), and energy-per-unit for energy-related initiatives. Instrument dashboards that show current state, trend, and the contribution of AIOps-driven actions.

Use short, measurable hypotheses (for example: “correlation reduces duplicate alerts for Service X by Y%”) to validate both technical and business impact during the rollout.

The 90‑day phased rollout

Phase 1 — Weeks 0–4: kickoff and foundation. Assemble a small, cross-functional team (ops, OT/engineers, security, and a product owner). Complete source inventory, deploy collectors to high-value systems, sync CMDB and ownership data, and enable a read-only service map. Deliverable: a working data pipeline and a shortlist of top-5 incident types.

Phase 2 — Weeks 5–8: detection and context. Deploy auto-baselining and initial anomaly rules against a subset of services and assets. Implement dependency-aware correlation for those assets and create the first runbook templates. Integrate with ITSM for ticket creation and notifications. Deliverable: validated detections and one automated, human‑approved runbook in production.

Phase 3 — Weeks 9–12: automation, measurement, and scale. Harden runbooks with staged automation and rollback, expand coverage to remaining critical assets, and enable forecasting/capacity features where useful. Finalize dashboards, define handover processes, and run a formal review of ROI against baseline metrics. Deliverable: production-grade automation for top incidents and a business impact report for stakeholders.

Governance, safety, and continuous improvement

Throughout rollout enforce security and compliance: encrypted transport, least-privilege access, retention policies, and audit trails for every automated action. Treat automation like a controlled change: canary actions, approval workflows, and post-mortem learning loops. Schedule regular cadences (weekly ops reviews, monthly model retraining and policy reviews) to keep detections accurate and playbooks current.

With a validated architecture and early wins in hand, you’ll be ready to compare platforms against real operational needs and prioritize tooling decisions that lock in those gains and drive technology value creation.

Tooling landscape and buying checklist

Coverage and openness: APIs, streaming, edge agents, and data gravity

Choose platforms that meet your deployment reality rather than forcing you to reshape operations. Key signals of fit:

Correlation at scale with explainability (not black-box alerts)

Correlation quality separates marketing claims from operational value. Don’t accept opaque AI: demand explainable correlations and evidence that links alerts to probable causes.

Automation safety: blast-radius controls, canary actions, and audit trails

Automation must be powerful and constrained. Verify the platform’s safety primitives before you enable autonomous remediation.

Cost governance: ingest economics, retention tiers, and data minimization

Telemetry costs can outpace value if not governed. Make economics part of the buying conversation.

Security alignment: ISO 27001/SOC 2/NIST controls and role-based access

Security posture and compliance are non-negotiable. Request evidence and map vendor controls to your requirements:

Customer outcomes to demand: MTTR down, false positives down, OEE up

Vendors should sell outcomes, not only features. Ask for measurable, contractable outcomes and proof points:

When comparing tools, score them not only on immediate feature match but on long-term operability: how they fit your data topology, how safely they automate, and how clearly they demonstrate business impact. With that scorecard in hand you can short-list vendors for a focused, metric-driven pilot that proves whether a platform will deliver uptime, quality, and ROI.

AI document processing: from OCR to measurable outcomes in 90 days

Paper, PDFs, faxes, screenshots — most businesses still live in a world where critical decisions depend on trapped text. AI document processing pulls that information out reliably, routes it to the right system, and turns manual busywork into measurable results. In this guide I’ll show how you can go from plain OCR to a production-ready pipeline that reduces errors, cuts cycle time, and delivers measurable impact in 90 days.

This isn’t vaporware or a one‑size‑fits‑all checklist. We’ll focus on practical steps: which document types to start with, how to measure accuracy and straight‑through processing, where humans belong in the loop, and the operational and security choices that matter for regulated industries like healthcare and insurance.

  • What modern document processing actually does (and what it doesn’t): ingestion, layout understanding, extraction, validation, and continuous learning.
  • How to pick the right mix of generative models and deterministic parsers so you only use expensive AI where it helps most.
  • A realistic 30/60/90 plan you can run in parallel with day‑to‑day work: label a few dozen real samples, add human review and thresholds, then stabilize for production.
  • Concrete success metrics to watch: straight‑through rate, exception volume, operator time per document, and cost‑per‑page.

Read on if you want a clear path — not a promise — to measurable outcomes: fewer manual hours, fewer errors, and faster decisioning. By the end of this post you’ll have a practical checklist and the key tradeoffs to decide whether to build, buy, or blend your way to production.

What AI document processing is today (and what it isn’t)

The modern pipeline: ingestion, layout, classification, extraction, validation, human‑in‑the‑loop, continuous learning

Modern AI document processing is best understood as a modular pipeline rather than a single monolithic model. Raw inputs are captured (scanned images, PDFs, email attachments, mobile photos) and preprocessed to normalize resolution, deskew pages, and clean noise. Layout analysis follows: the system detects pages, reading order, blocks, tables and visual cues that define where useful information lives.

Next, classification routes documents to the correct processor by type (invoices, forms, letters, claims) and purpose. Extraction pulls structured fields and free‑text passages using a mix of techniques (layout-aware models, entity recognition, table parsers). Validation applies business rules and cross‑field consistency checks, flagging anomalies for review.

Human reviewers remain a core component: exception queues, adjudication UIs and fast annotation loops close the gap between model output and business requirements. Those human corrections are fed back into retraining or incremental learning processes so accuracy improves over time. Operational pieces—logging, lineage, metrics and versioning—ensure traceability and safe rollouts.

GenAI plus deterministic parsers: choose the right method per field and document

“AI document processing” today is not an either/or choice between generative models and rule engines; the most reliable systems combine both. Deterministic parsers (regex, rule templates, coordinate-based table readers) are predictable, auditable, and ideal for high‑guarantee fields such as IDs, currency amounts, dates and standard codes.

Generative and large language models excel at fuzzy tasks: summarization, extracting context from ambiguous phrasing, mapping varied phrasing to canonical labels, and filling gaps when formatting is inconsistent. However, they can hallucinate or be less repeatable without strong guardrails.

Best practice is per‑field routing: attempt deterministic extraction first for critical fields, use ML/GenAI to handle messy inputs or to reconcile conflicting candidates, and always apply business validation before committing results. This hybrid approach balances accuracy, explainability and engineering cost.

Accuracy math: field‑ vs document‑level, confidence thresholds, and error budgets

Accuracy must be defined at the level that matters to the business. Field‑level accuracy measures how often a specific data point is correct; document‑level accuracy measures whether the entire document is processed without manual intervention. A high field accuracy does not automatically translate into high document accuracy—documents often contain multiple critical fields, and a single error can force manual handling.

Confidence scores are the operational bridge between model output and automation. Set per‑field confidence thresholds that reflect business risk: high‑risk fields get higher thresholds and strict validation, lower‑risk fields can have lower thresholds and lighter review. Use calibrated probabilities (not raw logits) so thresholds behave predictably across document types.

Design an error budget: decide how many errors you can tolerate per thousand documents before outcomes are unacceptable, then allocate that budget across fields and flows. Measure precision and recall for each extraction target, monitor drift, and iterate—improvements should be driven by the fields that consume the largest portion of your error budget or cause the most downstream cost.

Integration basics: APIs, events, and where humans step in

Production document pipelines are services that integrate with other systems via APIs and events. Typical building blocks include an ingestion API (or connectors to mail, EHRs, claim portals), webhook/event streams for processing updates, and status endpoints to query document state. Design for idempotency, batching, rate limits and graceful retries so upstream systems can operate reliably.

Human intervention points must be explicit and user‑centric: clear exception UIs, prioritized queues, and contextual snippets that let reviewers fix errors quickly. Push events when human action is required and pull events when processing completes; record audit trails for every decision to support compliance and debugging.

Operational observability is essential: SLAs for latency, metrics for straight‑through rate and time‑to‑resolution, alerting on regressions, and automated fallbacks when services fail. When these integration and operational concerns are addressed, AI document processing becomes a dependable component of business workflows rather than an experimental toy.

With the pipeline, hybrid model strategy, accuracy thinking and integration patterns clear, you’re ready to look at concrete workflows where these choices determine speed to value—how to prioritize documents, configure thresholds, and design the human touch so ROI appears within weeks rather than months.

Workflows with the fastest ROI in healthcare and insurance

Healthcare: ambient clinical documentation, prior authorization, revenue cycle coding, EHR data abstraction

Start with document- and conversation-driven workflows that directly free clinician and admin time. Ambient clinical documentation (digital scribing + automatic note generation) reduces time spent in EHRs and eliminates repetitive typing. Prior authorization routing and intake automation convert multi‑step, paper-heavy approvals into structured data flows that trigger downstream decisions faster. Revenue cycle tasks—claims coding, charge capture and denial management—are particularly lucrative because small accuracy improvements multiply into large cashflow gains. Finally, targeted EHR data abstraction (discrete problem lists, med lists, lab values) removes manual abstraction work for research, reporting and billing.

To move quickly: pick one of these workflows, map the document sources and exception triggers, instrument confidence thresholds that route low-confidence items to human review, and measure straight‑through processing and operator time per document as early success metrics.

Expected impact: 20% less EHR time, 30% less after‑hours work, 97% fewer coding errors

“AI-powered clinical documentation and administrative automation have delivered measured outcomes: ~20% decrease in clinician time spent on EHR, ~30% decrease in after‑hours work, and a 97% reduction in billing/coding errors.” Healthcare Industry Challenges & AI-Powered Solutions — D-LAB research

Those outcomes align with high‑leverage wins: reducing clinician EHR time improves throughput and morale, while cutting coding errors directly increases revenue capture and reduces audit risk. Track clinician minutes saved per visit, after‑hours edits, denial rate and coding error rate to quantify ROI within weeks of deployment.

Insurance: claims intake, underwriting submissions, compliance filings and monitoring

Insurers see fastest returns when automating document intake and the first mile of decisioning. Claims intake—extracting claimant details, incident descriptions, policy numbers and attachable evidence—lets straight‑through cases be paid without human review. Underwriting submissions benefit from automated risk feature extraction and standardized summaries for underwriters. For regulatory teams, automating filing assembly and rule‑based checks reduces manual research time and the chance of errors across jurisdictions.

Implementation pattern: start with a high‑volume, low‑variance document type (e.g., first‑notice‑of‑loss claims or standard underwriting forms), instrument deterministic parsers for critical fields, and add ML models for free‑text context and fraud signal detection. Measure closed claims per FTE, cycle time and exception queue depth to demonstrate value.

Expected impact: 40–50% faster claims, 15–30× faster regulatory updates, fewer fraudulent payouts

“Document- and process-automation in insurance has shown ~40–50% reductions in claims processing time, 15–30× faster handling of regulatory updates, and substantial reductions in fraudulent payouts (reported 30–50% in some cases).” Insurance Industry Challenges & AI-Powered Solutions — D-LAB research

Those gains come from eliminating manual data entry, surfacing rule‑based rejections faster, and freeing skilled staff for complex adjudication. Prioritize metrics such as claims lead time, percent paid straight‑through, regulatory filing turnaround, and fraud detection precision to convert process improvements into dollar savings.

Choose one high‑volume workflow per business unit, instrument the right mix of deterministic and ML extraction, and obsess on a handful of KPIs (straight‑through rate, operator minutes per doc, error rate, and cycle time). With those wins visible, it becomes straightforward to scale to adjacent document types and build momentum for broader automation efforts.

Build a minimum‑lovable IDP in 30/60/90 days

Days 0–30: pick 2 document types, label 50–100 real samples, baseline with prebuilt models

Start small and practical: choose two document types that are high‑volume and have clear value when automated (for example: intake forms + invoices, or prior‑auth requests + lab reports). Keep scope narrow so you can iterate quickly.

Collect 50–100 real, de‑identified samples per document type for labeling. Use representative variations (scans, photos, layouts) so your baseline reflects production diversity. Label the minimum set of fields that drive value—typically 6–12 fields per document (IDs, dates, totals, key narrative snippets).

Run a baseline using off‑the‑shelf OCR and prebuilt extraction models to get initial metrics: field accuracy, document‑level straight‑through rate, and average operator time per document. These baselines become your north star for improvement.

Days 31–60: add human‑in‑the‑loop, confidence thresholds, PHI/PII redaction, exception queues

Introduce a light human‑in‑the‑loop workflow. Configure per‑field confidence thresholds so only low‑confidence predictions or business‑rule failures go to review. This maximizes automation while controlling risk.

Build an efficient reviewer UI that shows the document image, highlighted fields, the model’s confidence, and quick actions (accept, correct, escalate). Track reviewer throughput and time‑to‑resolve to identify bottlenecks.

Implement privacy controls up front: PHI/PII redaction or masking in logs, role‑based access to sensitive fields, and audit trails for every human action. Create exception queues with clear SLAs and routing rules so critical cases get prioritized.

Days 61–90: production SLAs, drift monitoring, cost‑per‑page, retraining cadence

Move from pilot to production by defining SLAs (latency, straight‑through rate, max exception age) and embedding them into monitoring dashboards. Instrument cost‑per‑page metrics that include OCR, model inference, human review and storage to understand unit economics.

Deploy drift detection: monitor input characteristics, field‑level confidence distributions and error rates over time. Alert when metrics deviate beyond thresholds and capture representative failing samples automatically for retraining.

Set a retraining cadence driven by data volume and drift—start with a monthly or quarterly schedule and move to event‑driven retrains when you see systematic errors. Automate validation pipelines so new models are benchmarked against holdout sets before rollout.

Go/no‑go checklist: accuracy, straight‑through rate, operator time per doc, incident playbooks

Before full roll‑out, validate against a simple checklist: baseline vs current accuracy targets met, straight‑through rate above your business threshold, measurable reduction in operator minutes per document, and positive user feedback from reviewers.

Ensure operational readiness: incident playbooks for major failure modes, rollback procedures for model releases, alerting on SLA breaches, and a plan for urgent retraining or rule patches. Confirm compliance posture—retention policies, audit logs and access controls—are in place for production data.

When those checkpoints pass, you’ll have a minimal but lovable IDP that delivers measurable wins and a clear roadmap to expand. Next, tighten privacy controls, deployment choices and cost controls so the system scales safely and economically.

Thank you for reading Diligize’s blog!
Are you looking for strategic advise?
Subscribe to our newsletter!

Design for security, cost, and scale

PHI/PII safeguards: data residency, zero‑retention options, auditability, access controls

Treat sensitive fields as first‑class requirements. Design data flows so you can enforce residency constraints (keep data in specific regions), redact or tokenise identifiers early in the pipeline, and minimise persistent storage of raw images or full documents. Offer configurable retention policies: ephemeral processing for high‑risk content and longer retention only where business or legal needs require it.

Apply strong access controls and the principle of least privilege: separate roles for ingestion, review, model maintenance and administrators; require multi‑factor authentication and tightly scoped keys for service integrations. Capture immutable audit logs for every operation (who viewed or changed a field, when a model version was used) and make those logs searchable for investigations and compliance reviews.

Deployment choices: SaaS, VPC, on‑prem/edge—and how to pick for healthcare/insurance

Match deployment to risk and operational constraints. SaaS accelerates pilots and reduces ops burden, but may limit control over residency and retention. VPC or private cloud deployments provide stronger network isolation and are a good middle ground when you need cloud speed but stricter controls. On‑prem or edge deployments are appropriate when latency, regulatory mandates, or absolute data separation are non‑negotiable.

Choose by weighing three questions: (1) can the vendor meet your security and residency constraints; (2) does the deployment meet latency and throughput needs; and (3) what operational skills and budget are available to run updates, backups and audits. A common pattern is to pilot on SaaS, then migrate sensitive workloads into a private environment once requirements are stable.

Cost control: OCR and token spend, page complexity, batching/caching, template rarity

Estimate cost per page early and instrument it in production. Key drivers are image preprocessing (high‑res images cost more to OCR), model choices (large GenAI calls are expensive), and human review time. Reduce spend by normalising images (resize, compress), preclassifying pages to avoid unnecessary model calls, and applying cheaper deterministic extraction for high‑certainty fields.

Use batching and caching: group pages where models can process multiple items in a single call, cache results for repeated documents (e.g., standardized forms), and memoise expensive lookups. Track template rarity—support for a large long tail of unique templates increases manual work and inference cost; focus automation first on the high‑volume templates to maximize ROI.

Operational guardrails: rate limits, backpressure, fallbacks, retriable errors

Design for failure: enforce rate limits and queueing so bursts don’t overwhelm downstream services. Implement backpressure and graceful degradation—when the full-stack processor is saturated, fall back to a cheaper OCR+rule pipeline or enqueue documents for delayed processing rather than dropping them.

Use idempotent APIs, deterministic retry policies with exponential backoff, and circuit breakers for unstable dependencies. Provide clear SLAs for human review queues and automated alerts for growing exception backlogs. Finally, instrument end‑to‑end observability: latency, cost‑per‑page, straight‑through rate, and drift indicators so you can detect regressions before they affect business outcomes.

Balancing security, economics and reliability lets you scale automation without surprises. With those guardrails in place, the practical next step is to decide which procurement and engineering route best fits your use case—whether to adopt prebuilt cloud services, invest in custom processors, or combine both into a hybrid approach—and how to evaluate vendors and architectures against the metrics that matter to your business.

Buy, build, or blend? A decision framework

When to use Google/AWS/Azure prebuilt vs custom processors and domain models

Use prebuilt cloud services when you need speed-to-value, broad format coverage, and minimal engineering effort: high-volume, common document types with predictable layouts are ideal. Choose custom processors when documents are domain‑specific, templates are rare, explainability is crucial, or compliance and residency rules require tighter control. Consider a blended approach when some fields are deterministic (use rule engines) and others require ML or domain language models — this gets you reliable coverage quickly while targeting engineering effort where it pays off.

Evaluate on your documents: accuracy on key fields, annotation UX, explainability, API fit

Evaluate candidates with a short, repeatable process: build a representative sample set, annotate a held‑out test set, and run blind evaluations. Measure accuracy on the small set of fields that drive business outcomes rather than broad, generic metrics. Score vendor and open‑source options for annotation UX (how fast your team can label and correct), model explainability (can the system justify outputs), integration ergonomics (API style, webhook support, batching), and operational controls (versioning, rollback, monitoring hooks).

North‑star metrics: straight‑through processing, exception rate, cycle time, time‑to‑correct

Pick a few north‑star metrics that tie directly to business value. Straight‑through processing (percentage of documents fully automated) translates to headcount and time savings. Exception rate and backlog growth show friction and hidden costs. Cycle time (from ingestion to final state) affects customer experience and cashflow. Time‑to‑correct (how long an operator needs to fix an error) drives operational cost — optimize UIs and confidence routing to minimize it.

Total value model: hours saved, error cost avoided, compliance risk reduced, staff burnout relief

Build a simple total value model that converts automation metrics into dollars and risk reduction. Estimate hours saved per document and multiply by blended operator cost to get labor savings. Quantify error cost avoided using historical rework, denial or refund rates. Include risk adjustments for compliance exposure and potential fines where applicable. Don’t forget qualitative benefits — faster turnaround, improved employee morale, and lower attrition — and convert them to conservative financial values where possible.

In practice, run a short proof‑of‑concept: baseline on a realistic sample, compare options against the north‑star metrics, and use the total value model to choose buy, build or blend. With vendor fit and ROI clear, the next step is to lock down operational controls for privacy, cost and reliability so the solution scales without surprises.

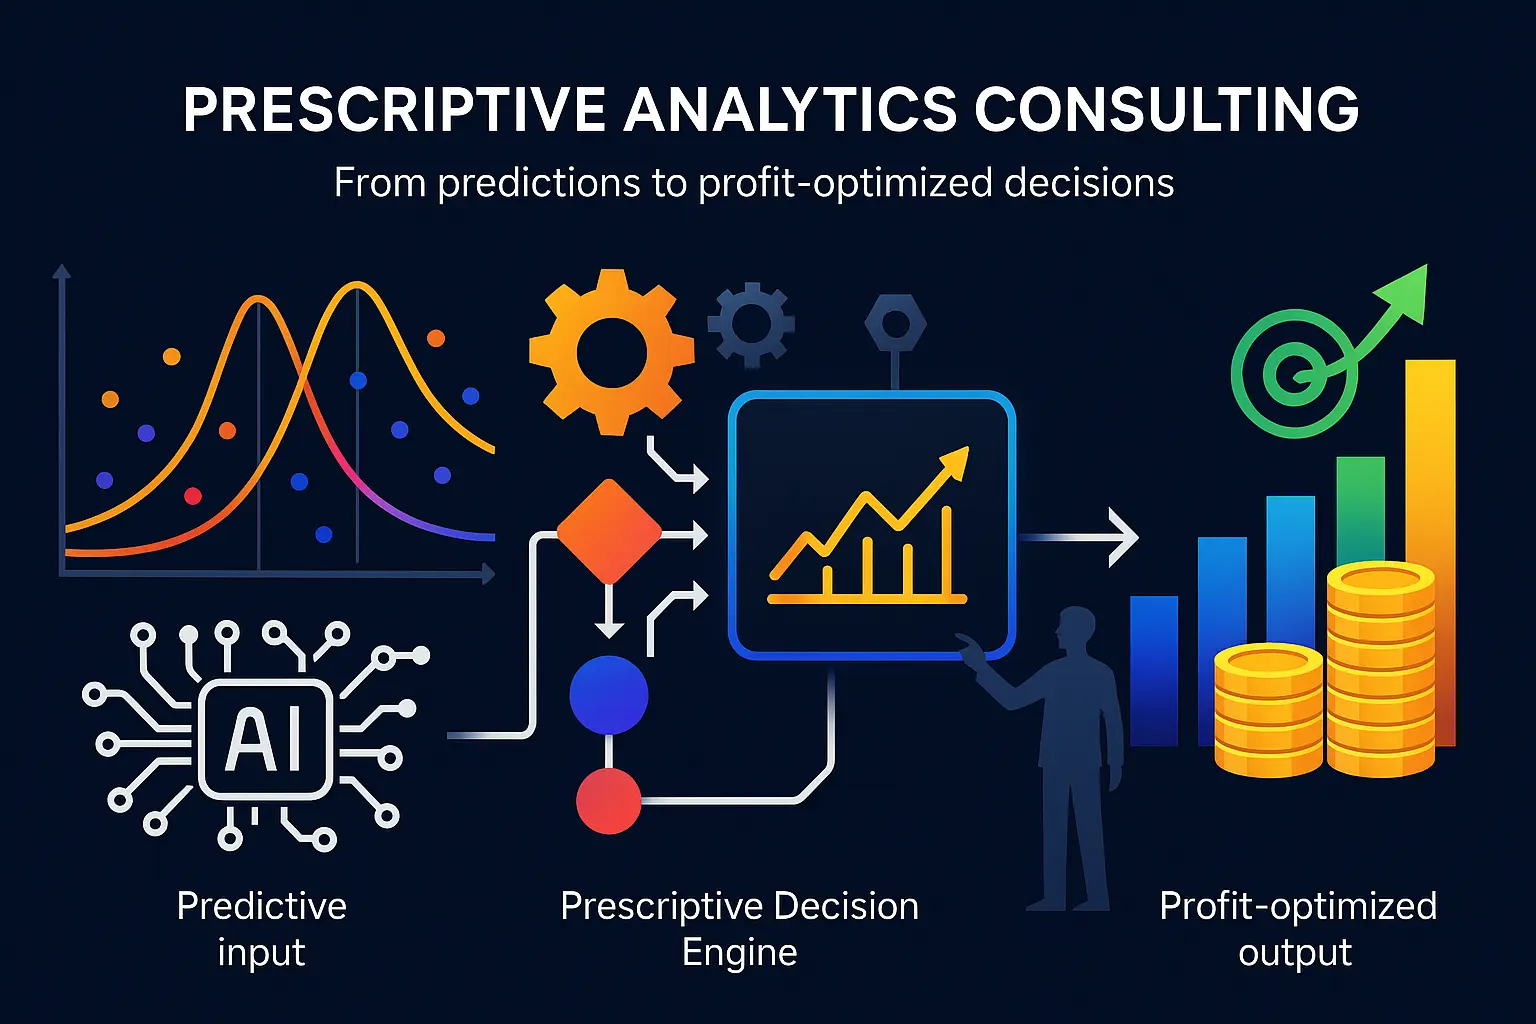
Prescriptive Analytics Consulting: From predictions to profit-optimized decisions

Most analytics stops at “what happened” or “what will probably happen.” Prescriptive analytics takes the next — and much harder — step: it says what to do. It turns forecasts into concrete, constrained decisions that balance revenue, cost, risk and customer impact so teams can act with confidence instead of guessing.

Think of prescriptive analytics as decision engineering. It combines forecasts with optimization, simulation and policy logic (and increasingly reinforcement learning) to recommend—or even automate—the best course of action given real‑world limits: budgets, inventory, legal rules and human approvals. The goal isn’t prettier dashboards; it’s profit‑optimized, auditable choices that leaders can trust.

Why now? Data is richer, models are faster, and business environments change in minutes instead of months. That makes black‑box predictions useful but incomplete. Organizations that connect those predictions to clear objective functions and governance capture measurable value: smarter pricing, smarter retention plays, fewer operational failures, and tighter security decisions that protect value and buyer confidence.

In this article you’ll get a practical primer: what prescriptive analytics really is, the core methods (optimization, simulation, causal tools and RL), the decision inputs you must capture, quick wins by function (pricing, retention, operations, risk), a 90‑day consulting playbook to earn executive trust, and the outcomes that move valuation—not just dashboards.

If you’re responsible for a high‑stakes decision — commercial strategy, supply chain resilience, or security posture — read on. This is about turning data and models into decisions that actually improve the bottom line and can be measured at exit.

What prescriptive analytics is—and why it matters now

Prescriptive analytics turns insight into action. Where descriptive analytics summarizes what happened and predictive analytics forecasts what will likely happen, prescriptive analytics recommends the specific choices that maximize business objectives given real-world limits. It’s the layer that closes the loop between data and decisions—so organizations don’t just know the future, they act on it optimally.

From descriptive and predictive to prescriptive: the leap to action

Descriptive tells you the story, predictive gives you a forecast, and prescriptive hands you the playbook. The leap to prescriptive is behavioural: it replaces manual judgment and one-size-fits-all rules with context-aware, measurable recommendations that account for competing goals (profit vs. service levels, speed vs. cost) and the fact that actions change outcomes. That makes prescriptive systems ideal for high-stakes, repeatable decisions where consistent, explainable trade-offs improve results over time.

Core methods: optimization, simulation, causal inference, reinforcement learning

Optimization is the workhorse: mathematical programs (linear, integer, nonlinear) translate objectives and constraints into a best-possible plan—think price schedules, schedules, or inventory policies that maximize margin or minimize cost.

Simulation lets teams model complex systems and stress-test candidate policies before committing—useful when outcomes are stochastic or when interventions have delayed effects.

Causal inference separates correlation from cause, ensuring prescriptive actions target levers that actually move the metric you care about (e.g., which retention tactics reduce churn versus merely correlate with it).

Reinforcement learning (RL) learns policies from interaction data for problems where decisions and outcomes form long-running feedback loops—RL shines in dynamic personalization, real-time bidding, and sequential maintenance decisions.

Decision inputs you need: forecasts, constraints, costs, risks, and trade‑offs

Prescriptive models consume more than a point forecast. They need probabilistic forecasts or scenario trees to represent uncertainty, explicit constraints (capacity, budgets, regulations), and accurate cost or reward models for actions. Risk preferences and business rules turn a theoretical optimum into an operational one: a solution that’s legal, auditable, and aligned with stakeholders.

Good deployment design also codifies guardrails—approval gates, human-in-the-loop overrides, and rollback paths—so decision recommendations become trusted tools rather than black-box edicts.

Data, privacy, and IP protection baked in (ISO 27002, SOC 2, NIST 2.0)

Security and IP stewardship aren’t an afterthought for prescriptive systems; they’re foundational. Reliable decisioning depends on trustworthy data flows, clear provenance, and controls that prevent leakage of models or strategic data. Integrating strong information-security frameworks into both development and deployment derisks automation and increases buyer and stakeholder confidence.

“IP & Data Protection: ISO 27002, SOC 2 and NIST frameworks defend against value‑eroding breaches — the average cost of a data breach in 2023 was $4.24M, and GDPR fines can reach up to 4% of annual revenue — so compliance readiness materially derisks investments and boosts buyer trust.” Portfolio Company Exit Preparation Technologies to Enhance Valuation — D-LAB research

With the methods, inputs, and controls in place, teams can move from experimentation to measurable, repeatable decisioning—next we’ll map the specific business areas where prescriptive analytics tends to deliver the fastest, highest-value wins.

Where prescriptive analytics pays off fastest

Prescriptive analytics delivers outsized returns where decisions are frequent, measurable, and directly tied to financial or operational objectives. The highest-impact areas share three traits: clear objective functions (revenue, cost, uptime), available data and systems to act on recommendations (CRM, pricing engines, MES/ERP), and a governance model that lets models influence outcomes quickly and safely. Below are the domains that typically produce the fastest, most defensible value.

Revenue engines: dynamic pricing, bundling, deal configuration, next‑best‑offer

Revenue processes are prime candidates because they generate immediate, measurable financial outcomes every time a decision is applied. Prescriptive analytics optimizes price points, recommends product bundles, and configures deals by balancing margin, conversion probability, and inventory or capacity constraints.

Operationalizing these recommendations—embedding them into the checkout flow, sales desk, or CPQ system—turns model outputs into recurring uplifts rather than one-off insights. The short feedback loop between action and revenue enables rapid experimentation and continuous improvement.

Retention: next‑best‑action, CS playbooks, sentiment‑driven outreach

Retention problems are often high-leverage: small improvements in customer churn or expansion can compound dramatically over time. Prescriptive systems prioritize accounts, prescribe tailored outreach scripts or offers, and recommend escalation paths based on predicted lifetime value, usage signals, and sentiment.

Because interventions (emails, offers, agent scripts) can be A/B tested and instrumented, prescriptive initiatives here produce clear causal evidence of impact, which accelerates executive buy-in and scaling across segments.

Operations: factory scheduling, inventory optimization, prescriptive maintenance

Operational domains—plant scheduling, inventory replenishment, and maintenance—are where constraints matter most. Prescriptive analytics formalizes those constraints and trade‑offs into optimization problems so planners get schedules and reorder decisions that maximize throughput, reduce shortage risk, and minimize cost.

These systems often integrate with existing ERP/MES and IoT feeds, allowing automated decision execution or tightly supervised human-in-the-loop workflows. The result: tangible reductions in downtime, stockouts, and expedited freight spend as recommendations convert directly into physical outcomes.

Risk & cybersecurity: policy tuning, incident response decisioning, access controls

Risk and security teams benefit from prescriptive approaches because the cost of false positives and false negatives is explicit. Analytics can recommend policy thresholds, prioritize incident responses, and automate access decisions to minimize exposure while preserving business flow.

Prescriptive rules paired with scoring let teams balance risk appetite against operational tolerance, and because incidents generate logged outcomes, teams can rapidly measure whether policy changes reduce time-to-detect, time-to-contain, or costly escalations.

In all these areas the fastest wins come from pairing a focused decision objective with a reproducible execution path: clear metrics, integrated systems that can apply recommendations, and experiments that prove causality. That combination makes it practical to design a short, high‑confidence rollout that demonstrates value to executives and users alike—and primes the organization for systematic scale.

A 90‑day prescriptive analytics consulting plan that earns executive trust

This 90‑day plan is built to deliver measurable wins fast while establishing the governance, transparency, and operational plumbing executives need to sign off on scale. The sequence focuses on: (1) mapping the decision and its constraints; (2) delivering a working predictive + decisioning prototype; (3) deploying with human oversight and auditable controls; (4) proving value through controlled experiments; and (5) preparing production-scale MLOps and optimization embedding. Each phase is time‑boxed, outcome‑driven, and tied to clear KPIs so leadership can see risk and reward in real time.

Map high‑stakes decisions and constraints; define the objective function

Week 0–2: convene a short steering committee (CRO/COO/Head of Data + 2–3 stakeholders) and run decision‑mapping workshops. Identify the one or two high‑frequency, high‑value decisions to optimize, capture the objective function (e.g., margin vs conversion, uptime vs cost), and list hard constraints (capacity, regulation, SLAs).

Deliverables: a one‑page decision spec (objective, constraints, KPIs), a prioritized backlog of supporting data sources, and an explicit acceptance criterion executives can sign off on (target KPI uplift and acceptable downside scenarios).

Build the predictive layer and connect it to decision logic (rules + optimization)

Week 3–6: create lightweight, reproducible predictive models and a minimal decision engine. Parallelize work: data engineers build a curated feature set and connectors while data scientists prototype probabilistic forecasts. Decision scientists translate the objective function into rules and/or an optimization formulation and produce candidate policies.

Deliverables: baseline model metrics, an API/endpoint that returns predictions and recommended actions, and a test harness that simulates decisions under sampled scenarios so stakeholders can compare candidate policies.

Governed deployment: human‑in‑the‑loop, approvals, audit trails, rollback

Week 7–9: design the governance layer before wide rollout. Implement human‑in‑the‑loop gates, approval matrices, and explainability notes for each recommended action. Add audit trails, versioned model artifacts, and a clear rollback plan to revert to safe defaults if KPIs degrade.

Deliverables: a staged deployment plan (sandbox → pilot → controlled release), role‑based access controls, an incident response / rollback runbook, and a short training session for operators and approvers that demonstrates how to read recommendations and exceptions.

Prove value fast: sandboxes, digital twins, champion/challenger tests

Week 10–12: run tightly scoped pilots that isolate causal impact. Use sandboxes or digital‑twin simulations where actions can be applied without business disruption, and run champion/challenger or A/B experiments where feasible. Measure against the acceptance criteria set in Week 0–2 and prioritize metrics that matter to the steering committee (revenue, cost savings, churn reduction, uptime).

Deliverables: experiment results with statistical confidence, a concise executive one‑pager showing realized vs. expected impact, and documented learnings that reduce model and operational risk.

Scale with MLOps + optimization engines embedded into workflows

Post‑pilot (day 90+): operationalize the stack for repeatability and scale. Hand over production pipelines with CI/CD, monitoring, alerting, drift detection, and automated retraining triggers. Embed the optimization engine into existing workflows (CRM, CPQ, MES) so recommendations execute with minimal friction, and set up quarterly review cadences to refresh objective weights and constraints as business priorities evolve.

Deliverables: production MLOps playbook, monitoring dashboards with business KPIs and model health metrics, SLAs for model performance, and a rollout roadmap for additional decision domains.

Because every step is tied to signed acceptance criteria, clear rollback paths, and measurable pilots, executives can watch value materialize while controls keep downside bounded — giving the team the credibility to move from a single pilot to enterprise‑wide decision automation and to quantify the financial outcomes leadership expects next.

Thank you for reading Diligize’s blog!
Are you looking for strategic advise?
Subscribe to our newsletter!

Outcomes that move valuation—not just dashboards

Prescriptive analytics succeeds when it translates models into measurable, repeatable financial outcomes that investors and acquirers care about—higher revenue, wider margins, lower churn, more predictable capital efficiency, and reduced operational risk. Below are the outcome categories that consistently shift valuation levers, with practical notes on how prescriptive decisioning delivers each result.

Revenue lift: +10–25% from dynamic pricing and recommendations

Embedding optimization into pricing engines, recommendation services, and deal configuration (CPQ) converts insights directly into higher order value and better margin capture. Prescriptive pricing adjusts to demand, competitor moves, and customer willingness to pay while bundling and next‑best‑offer logic increase average deal size and conversion—delivering recurring uplifts rather than one‑time analytics wins.

Retention: −30% churn, +10% NRR via prescriptive CS and call‑center assistants

Small changes in churn compound into large valuation effects. Prescriptive systems prioritize at‑risk accounts, recommend personalized interventions (discounts, feature nudges, success playbooks), and guide agents with context‑aware scripts and offers. When actions are instrumented and A/B tested, teams can prove causal lift in renewal and expansion metrics that directly improve recurring revenue multiples.

Manufacturing: −50% unplanned downtime, −40% defects, +30% output

Operations benefit from decisioning that respects hard constraints (capacity, lead times) while optimizing for throughput and cost. Prescriptive maintenance schedules, constrained production planning, and inventory optimization reduce emergency spend and scrap while increasing usable output—effects that strengthen margins, capital efficiency, and acquirer confidence in repeatable operations.

Workflow ROI: 112–457% over 3 years; 40–50% task automation

“AI co‑pilots and workflow automation deliver outsized returns — Forrester estimates 112–457% ROI over 3 years; automation can cut manual tasks by 40–50% and scale data processing by ~300x, driving rapid operational leverage.” Portfolio Company Exit Preparation Technologies to Enhance Valuation — D-LAB research

Beyond raw productivity, prescriptive co‑pilots and agents standardize decision quality and compress time to execution—turning variable human performance into consistent, auditable outcomes that scale. Those gains feed both cost reduction and faster product/feature iterations.

Cyber resilience: lower breach risk boosts buyer trust and valuation multiples

Reducing security risk is a valuation lever often overlooked by analytics teams. Prescriptive decisioning can tune access policies, prioritize patching and incident responses, and recommend containment actions that minimize expected loss. Demonstrable improvements in cyber posture and compliance reduce transaction risk and support higher exit multiples.

Across these categories the common thread is measurable causality: prescriptive projects that pair clear business metrics, controlled experiments, and executable integrations produce the evidence buyers and boards want to see. That evidence then guides selection criteria—both for the technical stack and for the partner who will help embed decisioning into the business—so you can confidently move from pilot wins to enterprise value creation.

Choosing a prescriptive analytics consulting partner

Picking the right partner is less about tech buzzwords and more about three things: decision science competence, repeatable playbooks that match your use cases, and the security & integration discipline to make recommendations operational and auditable. Below are practical selection criteria, questions to ask, and red flags to watch for when you evaluate firms.

Decision‑science first: clear objectives, constraints, and explainable trade‑offs

Look for teams that start by modeling the decision, not by building models for models’ sake. A strong partner will:

Questions to ask: How do you represent objective trade‑offs? Can you show an example of an explainable recommendation delivered to an operator?

Proven playbooks in pricing, retention, and operations (not just models)

Prefer partners who bring repeatable playbooks and outcome evidence for your domain. Proof points should include case studies that describe the decision being automated, the experimental design (A/B/champion‑challenger), and the realized business impact tied to clear KPIs.

Security posture: industry‑grade security, audits, and clear data handling

Security and IP protection must be baked into solution design. The partner should be able to explain: how customer data will be ingested and stored, who sees model artifacts, and what third‑party attestations or audit reports they can provide. Verify data residency, encryption, access controls, and incident response responsibilities before production work begins.

Red flags: reluctance to put data‑handling rules into the contract, vague answers about audits, or one‑off manual data processes that expose sensitive information.

Stack fit: ERP/MES/CRM integration, MLOps, and change management

Successful prescriptive systems need operational integration. Confirm the partner’s experience with your stack and their plan for production readiness:

Contracting for outcomes: KPIs, A/B guardrails, SLAs, and rollback plans

Structure agreements around measurable milestones and safety gates. Good contracts include:

Negotiate a payment schedule that balances vendor incentives with your risk—e.g., a fixed pilot fee, followed by outcome‑linked payments for scaled delivery.

Putting these criteria together will help you choose a partner who can both deliver early wins and embed prescriptive decisioning safely into your operations. With the right partner in place, the natural next step is a short, outcome‑focused program that proves value quickly and creates the operational foundation to scale decision automation across the business.

Predictive Modeling Consulting: ship models that move revenue, retention, and valuation

Predictive models are no longer an experimental R&D toy — when built and deployed the right way they become everyday tools that move the needle on revenue, retention, and company value. This article is about the practical side of that work: how to ship models that actually get used, prove their impact quickly, and compound into long‑term business advantage.

We’ll walk through the places predictive modeling delivers most: improving customer retention and lifetime value with churn and health‑scoring; lifting topline through smarter recommendations, pricing, and AI sales agents; reducing risk with better forecasting and credit signals; and cutting costs with anomaly detection and automation. Instead of abstract promises, the focus is on concrete outcomes you can measure and the small experiments that make big differences.

The playbook you’ll see here is valuation‑first and pragmatic. It starts with data foundations and security, then moves to 90‑day wins you can ship fast (e.g., lead scoring, pricing tests, retention hooks), and scales into 12‑month compounding opportunities like predictive maintenance or demand optimization. Along the way we cover governance, feature pipelines, MLOps, and adoption tactics so models don’t just run — they stick and scale.

Read on for a step‑by‑step look: where to start, what quick wins to prioritize, how to protect the value you create, and a 10‑point readiness checklist that tells you whether a model is ready to deliver real, tracked ROI. If you want less theory and more playbook — this is the part that gets you from prototype to product.

Where predictive modeling pays off right now

Retention and LTV: churn prediction, sentiment analytics, and success health scoring

Start with models that turn signals from product usage, support interactions, and NPS into an early-warning system for at-risk accounts. Predictive churn scores and health signals let customer success teams prioritise proactive outreach, tailor onboarding, and automate renewal nudges—small changes in workflow that compound into higher retention and predictable recurring revenue.

“GenAI analytics and customer success platforms can increase LTV, reduce churn by ~30%, and increase revenue by ~20%. GenAI call‑centre assistants can boost upselling and cross‑selling by ~15% and lift customer satisfaction by ~25%.” Portfolio Company Exit Preparation Technologies to Enhance Valuation. — D-LAB research

Topline growth: AI sales agents, recommendations, and dynamic pricing that lift AOV and close rates

Predictive models that score leads, prioritise outreach, and suggest next-best-actions increase close rates while lowering CAC. Combine buyer intent signals with real‑time recommendation engines and dynamic pricing to raise average order value and extract more margin from existing channels without reengineering the GTM motion.

“AI sales agents and analytics tools can reduce CAC, improve close rates (+32%), shorten sales cycles (~40%), and increase revenue by ~50%. Product recommendation engines and dynamic pricing can drive 10–15% revenue gains and 2–5x profit improvements.” Portfolio Company Exit Preparation Technologies to Enhance Valuation. — D-LAB research

Forecasting and risk: demand planning, credit scoring, and pipeline probability

Models for demand forecasting and probabilistic pipeline scoring reduce stockouts and wonky forecasts, freeing working capital and smoothing production planning. In finance‑adjacent products, credit and fraud scoring models tighten underwriting, lower losses, and enable smarter risk‑based pricing. These capabilities make capital allocation more efficient and reduce volatility in reported results.

Efficiency and quality: anomaly detection, workflow automation, and fraud reduction

Operational models that flag anomalies in telemetry, transactions, or quality metrics prevent defects and outages before they cascade. Automating routine decision steps with AI co‑pilots and agents reduces manual toil, accelerates throughput, and raises human productivity—so teams focus on exceptions and value work instead of repetitive tasks.

“Workflow automation, AI agents and co‑pilots can cut manual tasks 40–50%, deliver 112–457% ROI, scale data processing ~300x, and improve employee efficiency ~55%. AI agents are also reported to reduce fraud by up to ~70%.” Portfolio Company Exit Preparation Technologies to Enhance Valuation. — D-LAB research

Across these pockets—retention, topline, forecasting and ops—the common pattern is short time‑to‑value: focus on clear KPIs, instrument event‑level data, and ship a guarded experiment into production. That approach naturally leads into the practical next steps for protecting value, building data foundations, and turning early wins into compounding growth.

A valuation‑first playbook for predictive modeling consulting

Protect IP and data from day one: ISO 27002, SOC 2, and NIST 2.0 as growth enablers

Start every engagement by treating information security and IP protection as product features that unlock buyers and reduce exit risk. Run a short posture assessment (data flows, secrets, third‑party access, PII touchpoints), then prioritise controls that buyers and auditors expect: encryption-at-rest and in-transit, least‑privilege access, logging and tamper‑proof audit trails, and clear data‑processing contracts with vendors.

“IP & Data Protection: ISO 27002, SOC 2, and NIST frameworks defend against value-eroding breaches, derisking investments; compliance readiness boosts buyer trust.” Portfolio Company Exit Preparation Technologies to Enhance Valuation. — D-LAB research

Use certifications and attestations as commercial collateral: an SOC 2 report or an ISO alignment checklist reduces buyer diligence friction and often shortens deal timelines. Remember the business case for doing this early:

“Average cost of a data breach in 2023 was $4.24M (Rebecca Harper).” Portfolio Company Exit Preparation Technologies to Enhance Valuation. — D-LAB research

“Europes GDPR regulatory fines can cost businesses up to 4% of their annual revenue.” Portfolio Company Exit Preparation Technologies to Enhance Valuation. — D-LAB research

Data foundations that derisk modeling: clean events, feature store, governance, and monitoring

Predictive models are only as valuable as the signals that feed them. Build a minimal but disciplined data foundation before modelling: instrument event‑level telemetry with clear naming and ownership, enforce data contracts, and centralise features in a feature store with lineage and access controls. Pair that with an observability stack (metric, versioned model outputs, drift detectors) so business stakeholders can trust model outputs and engineers can debug quickly.

Make product/ops owners accountable for definitions (what “active user” means), and codify those definitions in the feature pipeline—this prevents silent regressions when product behaviour or schema change.

90‑day wins: retention uplift, pricing tests, rep enablement, and lead scoring in production

Design a 90‑day delivery sprint focused on one measurable KPI (e.g., lift in renewal rate or AOV). Typical 90‑day plays:

– Deploy a churn risk model with prioritized playbook actions for CS to run live A/B tests.

– Launch a dynamic pricing pilot on a small product cohort and measure AOV and conversion impact.

– Equip sales reps with an AI‑assisted lead prioritiser and content suggestions to reduce time-to-meeting and raise close rates.

Keep experiments narrow: run shadow mode and small‑sample A/B tests, instrument guardrails for model decisions, and track unit economics (value per prediction vs cost to serve). Early wins build stakeholder confidence and create the runway for larger programs.

12‑month compounding: predictive maintenance, supply chain optimization, and digital twins

After fast commercial experiments, invest in compounding operational programs that generate defensible margin expansion. Use the first year to move from pilot to platform: integrate predictive models with maintenance workflows, optimise inventory with probabilistic forecasts, and validate digital twin simulations against real‑world outcomes so planners can trust scenario outputs.

“30% improvement in operational efficiency, 40% reduction in maintenance costs (Mahesh Lalwani).” Manufacturing Industry Challenges & AI-Powered Solutions — D-LAB research

“50% reduction in unplanned machine downtime, 20-30% increase in machine lifetime.” Manufacturing Industry Challenges & AI-Powered Solutions — D-LAB research

These longer‑horizon programs expand EBITDA and create operational IP that acquirers value. Treat them as platform bets: invest in robust data ingestion, standardised feature engineering, and an MLOps pipeline that enforces SLAs for latency, availability and retraining cadence.

Together, these steps — secure the moat, ship high‑impact pilots, and then scale compounding operational programs — create a clear valuation narrative that links model outputs to revenue, cost and risk metrics. With this playbook in hand, the next step is to translate these levers for specific industries so priorities and timelines reflect sector realities and buyer expectations.

Industry snapshots: how the approach changes by sector

SaaS and fintech: NRR, churn prevention, upsell propensity, and credit risk signals

Prioritise models that map directly to recurring revenue levers: churn risk, expansion propensity, and lead-to-deal velocity. Start with event-level product telemetry, billing and contract data, CRM activity, and support interactions so predictions align with commercial workflows (renewals, seat expansion, account outreach).

Design interventions as part of the model: a risk score is only valuable if it triggers a playbook (automated in-app nudges, targeted success outreach, or tailored pricing). In fintech, add strict audit trails and explainability for any credit or fraud models so decisions meet regulatory and compliance needs.

Manufacturing: asset health, process optimization, and twins to reduce defects and downtime

Manufacturing projects tend to be operational and integration-heavy. Focus on reliable sensor ingestion, time‑series feature engineering, and rapid feedback loops between models and PLC/MES systems so predictions translate into maintenance actions or process adjustments.

Proofs of value are usually equipment or line specific: run pilots on a small set of assets, validate predictions against controlled maintenance windows, and evolve into a digital twin or plant‑level forecasting system only after the pilot demonstrates consistent ROI and data quality.

Retail and eCommerce: real‑time recommendations, dynamic pricing, and inventory forecasting

Retail demands low-latency inference and tight A/B experimentation. Combine customer behaviour signals with inventory state and promotional calendars to power recommendations and price adjustments that improve conversion without eroding margin.

Inventory forecasting models must be evaluated across service-level metrics (stockouts, overstocks) as well as revenue impact. Treat pricing pilots as experiments with clear guardrails and rollback paths to avoid unintended promotional cascades.

Across sectors, the practical differences are less about algorithms and more about data, integration, and governance: what data you can reliably capture, how models tie to operational decision paths, and what compliance or safety constraints apply. That understanding determines whether you launch a fast commercial pilot or invest in a year‑long platform build.

To make those choices predictable, the next step is to translate strategy into delivery: define the KPI map, data contracts, experiment design and deployment standards that let small wins compound into platform value and buyer‑visible traction.

Thank you for reading Diligize’s blog!
Are you looking for strategic advise?
Subscribe to our newsletter!

How we work: models that ship, stick, and scale

Value framing: KPI tree, decision mapping, and experiment design

We begin by translating business goals into a KPI tree that ties every prediction to revenue, cost or risk. That means defining the downstream decision a model enables (e.g., which accounts to prioritize for outreach, which price to serve, when to trigger maintenance) and the metric that proves value.

For each use case we codify the decision mapping (input → prediction → action → measurable outcome) and an experiment plan: hypothesis, target metric, sample size, guardrails, and a rollout path (shadow → canary → full A/B). Early, small‑scope experiments reduce implementation risk and create a repeatable playbook for later scale.

Feature factory: pipelines, quality checks, and reusable features

We build a feature factory that standardises event capture, feature engineering and storage so teams don’t recreate work for each model. Features are versioned, documented, and discoverable in a central store with clear ownership and data contracts.

Quality gates are enforced at ingestion and transformation: schema checks, null-rate thresholds, drift tests, and automated validation suites. Reusable feature primitives (time windows, aggregations, embeddings) speed iteration and reduce production surprises.

MLOps delivery: CI/CD for models, drift and performance monitoring, retraining cadence

Production readiness requires code and model CI/CD: reproducible training pipelines, containerised inference, automated tests, and a model registry with provenance. Deployments follow progressive strategies (shadow, canary) with automatic rollback on KPI regressions.

We instrument continuous monitoring for data and model drift, prediction quality, latency and cost. Alerts map to runbooks and a defined retraining cadence so models are retained, revalidated or retired with minimal manual friction.

Security by design: least privilege, encryption, audit logging, PII minimization

Security and compliance are embedded in the delivery lifecycle: threat modelling early, minimum necessary data access, secrets management, and encryption in transit and at rest. Audit logs and reproducible pipelines give both engineers and auditors the evidence they need.

We also design for privacy by default: minimise PII in features, use pseudonymisation where possible, and make data retention and access policies explicit so risk is controlled without blocking model value.

Adoption: playbooks for sales, service, and ops; human‑in‑the‑loop for edge cases

Models only deliver value when the organisation uses them. We ship adoption playbooks—role-based training, embedded UI prompts, decision support workflows and manager dashboards—that make model outputs actionable in day‑to‑day work.

For high‑risk or ambiguous decisions we design human‑in‑the‑loop flows with clear escalation paths and feedback loops so front‑line teams can correct and surface edge cases that improve model performance over time.

When value is framed, features are industrialised, delivery is disciplined, security is non‑negotiable and adoption is baked into rollout, the organisation moves from one‑off pilots to predictable, compounding model-driven outcomes. That operational readiness is what makes it straightforward to run a concise readiness assessment and prioritise the right first bets for impact.

What good looks like: a 10‑point readiness and success checklist

Event‑level data with clear definitions and ownership

Instrument the product and operational surface at event level (actions, transactions, sensor reads) and assign a single owner for each event schema. Clear definitions and a registry prevent semantic drift and make datasets auditable and reusable across models.

Executive sponsor and accountable product owner

Secure an executive sponsor who can unblock budget and cross‑functional dependencies, and name a product owner responsible for the model’s lifecycle, metrics and adoption. Accountability closes the gap between model delivery and commercial impact.

KPI tree linking predictions to revenue, cost, and risk

Map each prediction to a downstream decision and a measurable KPI (revenue uplift, cost avoided, risk reduction). A simple KPI tree clarifies hypothesis, target metric, and what success looks like for both pilots and scaled deployments.

Feature store and lineage to speed iteration

Centralise engineered features with versioning and lineage so teams can discover, reuse and reproduce inputs quickly. Feature lineage shortens debugging cycles and prevents silent regressions when upstream data changes.

SOC 2 / NIST control maturity and privacy impact assessment

Assess security and privacy posture early and align controls to expected risk tiers. Basic maturity in access controls, encryption, audit logging and a documented privacy assessment reduces commercial friction and legal exposure.

A/B and shadow‑mode plan with guardrails

Define an experiment framework that includes shadow mode, controlled A/B tests, rollout gates and rollback criteria. Guardrails should cover business KPIs, user experience and safety thresholds to avoid surprise negative outcomes in production.

Latency, availability, and drift SLAs

Specify operational SLAs for inference latency, uptime and acceptable model drift. Instrument monitoring and automated alerts so ops and data teams can act before performance impacts customers or revenue.

Human‑in‑the‑loop escalation paths

Design clear escalation flows for edge cases and ambiguous predictions. Human review with feedback capture improves model quality and builds trust with operators who rely on automated suggestions.

Unit economics tracked per prediction (cost to serve vs. value)

Measure cost-to-serve for each prediction (compute, storage, human review) and compare to incremental value delivered. Tracking unit economics ensures models scale only where they are profitable and aligns stakeholders on prioritisation.

ROI window within two quarters and a roadmap for year‑one compounding

Target initial pilots that can prove positive ROI within a short window and pair them with a one‑year roadmap that compounds value (wider coverage, automation, integration into ops). Short ROI windows win support; the roadmap turns wins into enduring platform value.

Predictive analytics consulting that lifts revenue, retention, and valuation

Predictive analytics isn’t a trendy buzzword — it’s a practical way to turn the data you already have into clearer decisions, steadier revenue, and fewer surprises. When you can forecast which customers are about to churn, which products will sell out, or which price will win the sale, you stop reacting and start shaping outcomes.

This article takes an outcomes-first view: how predictive models actually move the needle on revenue, retention, and company value. You’ll get concrete use cases — from dynamic pricing and recommendation engines to churn prediction and demand forecasting — plus a clear roadmap for going from idea to impact in about 90 days. No fluff, just the pieces that matter: the business signal, the right models, and the governance to keep gains real and repeatable.

If you’re skeptical about the payoff, that’s healthy. Predictive work only pays when it’s tied to measurable business KPIs and rolled into the way people make decisions. Read on and you’ll see the practical levers to test first, how to avoid common data and deployment traps, and how these wins show up not just in monthly revenue but in stronger retention and higher valuation when investors or acquirers take a closer look.

Outcomes first: revenue, retention, and risk reduction

Predictive analytics should start with outcomes, not models. The highest‑value projects tie a clear business metric (revenue, retention, or risk) to a measurable intervention and a short path to ROI. Below we map the core outcomes teams care about and how predictive systems deliver them in weeks, not years.

Revenue: dynamic pricing and recommendation engines that raise AOV and conversion

“Dynamic pricing can increase average order value by up to 30% and deliver 2–5x profit gains; implementations have driven revenue uplifts (e.g., ~25% at Amazon and 6–9% on average in other cases).” Portfolio Company Exit Preparation Technologies to Enhance Valuation — D-LAB research

Beyond the headline numbers, the mechanics are straightforward: combine real‑time demand signals, customer segment propensity scores, inventory state and competitor moves to price or bundle at a per‑customer level. Recommendation engines do the complementary work — surfacing the next best product or add‑on exactly when intent is highest, increasing conversion and deal size. When these capabilities are deployed together they amplify each other: smarter pricing increases margin per conversion while recommendations raise AOV and lifetime value.

Retention: churn prediction plus voice-of-customer sentiment to protect NRR

Retention is where predictive analytics compounds value. Churn models ingest usage, support, billing and engagement signals to surface accounts at risk days or weeks before renewal time. When those signals are combined with voice‑of‑customer sentiment and automated playbooks, teams can prioritize saves and personalize offers that are proven to work.

Companies that operationalize these signals see meaningful improvements in net revenue retention: predictive early warnings plus targeted success workflows reduce churn and unlock upsell opportunities, turning at‑risk accounts into higher‑value customers rather than lost revenue.

Risk: fraud/anomaly detection with IP & data protection baked in

Risk reduction is both defensive and value‑preserving. Fraud and anomaly detection models cut losses by spotting unusual patterns across transactions, sessions, or device signals in real time; automated gating and escalation workflows contain exposure while investigations run. At the same time, embedding robust data protection and IP controls into the analytics stack (access controls, encryption, logging and compliance mapping) de‑risks operations and makes the business more attractive to buyers and partners.

Protecting intellectual property and customer data isn’t just compliance — it prevents headline events that erode trust, preserves valuation, and supports price‑sensitive negotiations with strategic acquirers.

All three outcomes feed one another: pricing and recommendations lift revenue today, retention preserves and multiplies that revenue over time, and risk controls protect the gains from being undone by breaches or fraud. Next, we’ll break these outcome areas into high‑ROI predictive use cases you can pilot quickly to convert value into measurable business results.

High-ROI predictive use cases to start with

Choose pilots that link directly to revenue, retention, or cost avoidance and that can be validated with a small, controlled experiment. Below are six pragmatic, high‑ROI use cases with what to measure, the minimum data you’ll need, and a simple pilot approach you can run in 4–10 weeks.

Dynamic pricing to increase average order value and margin

Objective: increase margin and conversion by adjusting prices or bundles to customer context and real‑time demand.

What to measure: conversion rate, average order value (AOV), margin per transaction, and any change in cancellation/return behavior.

Minimum data: transaction history, product catalog and cost data, basic customer segmentation, and recent demand signals (sales velocity, inventory).

Pilot approach: run a controlled A/B test on a subset of SKUs or user segments using a rules‑based repricer informed by simple propensity models; iterate pricing rules weekly and expand once you see consistent lift.

Lead scoring with intent data to improve close rates and shorten cycles

Objective: prioritize and route the highest‑propensity leads so sales time is focused where it matters most.

What to measure: lead-to-opportunity conversion, win rate, sales cycle length, and revenue per rep.

Minimum data: CRM history, firmographic/contact attributes, engagement events (emails, site visits), and any third‑party intent signals you can integrate.

Pilot approach: train a simple classification model on recent closed/won vs closed/lost opportunities, combine it with intent signals to create a priority score, and test new routing rules for a sales pod over one quarter.

Churn prediction and success playbooks that trigger timely saves

Objective: identify accounts at risk early and automate targeted plays that recover revenue before renewal windows.

What to measure: churn rate, net revenue retention (NRR), success play adoption, and save rate for flagged accounts.

Minimum data: product usage metrics, support ticket/interaction logs, billing and renewal history, and customer health signals.

Pilot approach: deploy a churn classifier to produce risk tiers, map one tailored playbook per tier (email outreach, product walkthrough, discount, or executive touch), and track which plays yield the highest save rate.

Demand forecasting and inventory optimization to cut stockouts and excess

Objective: reduce lost sales from stockouts and lower holding costs by forecasting demand at SKU/location granularity.

What to measure: stockout incidents, fill rate, inventory turns, and carrying cost reduction.

Minimum data: historical sales by SKU/location, lead times, supplier constraints, promotional calendar, and basic seasonality indicators.

Pilot approach: build a short‑term forecasting model for a constrained product family, implement reorder point simulations, and compare inventory outcomes against a holdout period.

Predictive maintenance to reduce downtime and extend asset life

Objective: detect degradation early and schedule interventions that avoid unplanned outages and expensive repairs.

What to measure: unplanned downtime, maintenance costs, mean time between failures (MTBF), and production throughput.

Minimum data: sensor telemetry or machine logs, failure/maintenance records, and operational schedules.

Pilot approach: start with one critical asset class, develop anomaly detection or simple remaining‑useful‑life models, and deploy alerts to maintenance crews with a feedback loop to improve precision.

Customer sentiment analytics feeding your product roadmap

Objective: turn qualitative feedback into prioritized product improvements, feature bets, and retention initiatives.

What to measure: sentiment trends, frequency of feature requests, adoption lift after roadmap actions, and impact on NPS or churn.

Minimum data: support tickets, product reviews, NPS/comments, and call/transcript data where available.

Pilot approach: apply topic extraction and sentiment scoring to a rolling window of feedback, surface top themes to product teams, and run rapid experiments on one or two high‑impact items to prove causal impact.

Pick one or two of these use cases that map to your top KPIs, limit scope to a single product line or customer segment, and instrument experiments so wins are measurable and repeatable. Next, we’ll show how to operationalize those pilots — the pipelines, model controls and safeguards you need to scale impact without adding risk.

Build it right: data, models, security, and governance

Predictive value is fragile unless you build on disciplined data practices, pragmatic model choices, reliable operations, and airtight security. Below are the engineering and governance essentials that turn pilots into repeatable, auditable outcomes.

Data readiness and feature engineering that reflect real buying and usage signals

Start by mapping signal sources to business events: transactions, sessions, support interactions, sensor telemetry and third‑party intent feeds. Create a prioritized data intake plan (schema, owner, SLA) and a minimal canonical store for modeling.

Feature engineering should capture durable behaviors (recency, frequency, monetary buckets), context (device, geography, promotion) and operational constraints (lead times, minimum order quantities). Build a reusable feature store with lineage and automated backfills so pilots can be reproduced and new use cases can reuse the same features without rework.

Operational controls matter: enforce data quality gates (completeness, cardinality, drift), anonymize or pseudonymize PII before model training, and log transformations so explanations and audits are straightforward.

Model selection that fits the job: time series, classification, uplift, ensembles

Match the algorithm to the decision: time‑series and causal forecasting for demand and inventory; binary or multi‑class classifiers for churn, fraud and lead scoring; uplift models when you want to predict treatment effect; and ensembles when stability and accuracy matter. Avoid chasing the most complex model—prefer interpretable baselines and only add complexity when A/B tests justify it.

Design evaluation metrics that reflect business impact (e.g., revenue per test, cost avoided, saves per outreach) rather than only statistical measures. Where fairness or regulatory risk exists, include bias and fairness checks in model evaluation and keep human‑in‑the‑loop controls for high‑stakes interventions.

MLOps: monitoring, drift detection, retraining, and A/B testing in production

Production reliability is an engineering problem. Implement continuous monitoring for model performance (accuracy, calibration), data drift (feature distribution changes), input anomalies, and downstream business KPIs. Automate alerts and create runbooks for common failure modes.

Set up a retraining cadence informed by drift signals and business seasonality; keep a validation holdout and automated backtesting pipeline to avoid overfitting to most recent data. Use canary releases and controlled A/B tests to validate that model changes deliver the expected business lift before wide rollout.

Instrument full observability: prediction logs, decision provenance, feature snapshots and user feedback. That traceability keeps stakeholders confident and speeds root‑cause analysis when outcomes diverge.

Security and compliance mapping: ISO 27002, SOC 2, NIST 2.0 to protect IP & data

“ISO 27002, SOC 2 and NIST frameworks defend against value-eroding breaches and derisk investments; the average cost of a data breach in 2023 was $4.24M and GDPR fines can reach up to 4% of annual revenue—compliance readiness also boosts buyer trust.” Portfolio Company Exit Preparation Technologies to Enhance Valuation — D-LAB research

Translate framework requirements into concrete controls for your analytics stack: role‑based access and least privilege for datasets and models, end‑to‑end encryption (in transit and at rest), secure model storage and CI/CD pipelines, audit trails for data access and model changes, and data retention/deletion policies that meet regional privacy rules. Add automated secrets management, vulnerability scanning, and incident response playbooks so security is operational, not aspirational.

Protecting IP also means capturing and controlling model artifacts, reproducible pipelines and proprietary feature logic behind access controls — this preserves defensibility and reduces valuation risk when investors or acquirers perform diligence.

When these layers—clean signals, fit‑for‑purpose models, reliable ops and mapped security—are in place you move from fragile experiments to scalable, auditable systems that buyers can trust. With that foundation established, it becomes straightforward to sequence a short, focused implementation roadmap that delivers measurable impact within a quarter.

Thank you for reading Diligize’s blog!
Are you looking for strategic advise?
Subscribe to our newsletter!

A 90-day roadmap from idea to impact

This 13‑week plan compresses the essential steps from hypothesis to measurable business impact. Each phase has focused owners, concrete deliverables and clear success criteria so you can run tight experiments, de‑risk production, and prove value quickly.

Weeks 1–2: Value mapping, KPI baselines, and prioritized use cases

Goals: align stakeholders, pick 1–2 high‑ROI use cases, and set unambiguous success metrics.

Deliverables: value map linking use cases to revenue/retention/cost KPIs, baseline reports for key metrics, prioritized backlog, and an executive one‑page hypothesis for each pilot.

Owners & checks: business sponsor signs off the KPI baselines; product/data owner approves access requests. Success = baseline established + sponsor approval to proceed.

Weeks 3–4: Data audit, pipelines, and a reusable feature store

Goals: validate signal quality, establish reliable data flows, and create the first reusable features for modeling.

Deliverables: data inventory and gap analysis, prioritized ETL tasks with SLAs, deployed pipelines for historical and streaming data where needed, and an initial feature store with lineage and simple access controls.

Owners & checks: data engineer implements pipelines; data steward signs off data quality tests (completeness, freshness, cardinality). Success = production‑grade pipeline for core features and documented lineage for reproducibility.

Weeks 5–6: Pilot model, backtesting, and controlled A/B test plan

Goals: develop a minimally complex model that addresses the business hypothesis, validate it offline, and design a safe, controlled test for live evaluation.

Deliverables: trained pilot models, backtest reports showing uplift vs baseline, an A/B test plan (target population, sample size, metrics, duration), and risk mitigations for false positives/negatives.

Owners & checks: data scientist delivers models and test plan; legal/compliance reviews any customer‑facing interventions. Success = statistically powered test plan and a backtest that justifies live testing.

Weeks 7–10: Production deployment, training, and change management

Goals: roll out the pilot to production in a controlled way, enable the teams who act on predictions, and monitor early performance.

Deliverables: canary or staged deployment, prediction logging and observability dashboards, playbooks for sales/support/ops that use model outputs, training sessions for end users, and an initial runbook for incidents and rollbacks.

Owners & checks: MLOps/engineering owns deployment; business ops owns playbook adoption. Success = model serving with observability, active playbook usage, and first weekly KPI signals collected.

Weeks 11–13: Automation, dashboards, and scale to the next use case

Goals: automate repeatable steps, demonstrate measurable business lift, and create a playbook for scaling the approach to additional segments or products.

Deliverables: automated retraining pipeline or retraining cadence, executive dashboard showing experiment KPIs and ROI, documented handoff (SOPs, ownership, cost model), and a prioritized roadmap for the next use case based on impact and data readiness.

Owners & checks: product manager compiles ROI case; engineering automates pipelines; C-suite reviews rollout/scale recommendation. Success = validated lift on target KPIs, documented costs/benefits, and a signed plan to scale.

Run these sprints with short feedback loops: daily standups during build phases, weekly KPI reviews once the pilot is live, and a final stakeholder review at week 13 that summarizes lift, confidence intervals, and next steps. With measurable wins in hand you can then translate outcomes into the financial narratives and investor materials that show how predictive programs change growth, margins and enterprise value.

From predictions to valuation: how results show up in multiples

Investors don’t buy models — they buy predictable cash flows and defensible growth. Predictive analytics delivers valuation upside when you translate model-driven improvements into repeatable revenue, margin and risk reductions and then quantify those gains in the language of buyers: ARR/EBITDA and the multiples applied to them. Below are the practical levers and a simple framework to convert analytics outcomes into valuation uplift.

Revenue levers: bigger deals, more wins, stronger pricing power

Predictive systems increase top line in three repeatable ways: raise average deal size (personalized pricing, recommendations and bundling), improve conversion and win rates (lead scoring, intent signals), and accelerate repeat purchases (churn reduction and tailored retention). To show valuation impact, map each improvement to incremental revenue and margin: incremental revenue x contribution margin = incremental EBITDA. Aggregate annualized uplift becomes a plug into valuation models that use EV/Revenue or EV/EBITDA multiples.

Cost and efficiency: fewer defects, less downtime, automated workflows

Cost savings flow straight to the bottom line and often have less uncertainty than pure revenue moves. Predictive maintenance, demand forecasting and workflow automation reduce unplanned downtime, lower scrap and carrying costs, and shrink labour spent on repetitive tasks. Convert those operational gains into annual cost reduction and add the result to adjusted EBITDA. Because multiples on EBITDA are commonly used in buyouts and strategic deals, credible cost savings can materially raise enterprise value.

Risk and trust: compliant data, protected IP, resilient operations

Risk reduction is an understated but powerful valuation lever. Strong data governance, security certifications, and reproducible model pipelines reduce due-diligence friction and lower the perceived execution risk for buyers. Quantify risk reduction by modelling lower downside scenarios (smaller revenue volatility, fewer breach costs, lower churn spikes) and incorporate those into discounted cash flow sensitivity runs or risk‑adjusted multiples. Demonstrable controls and audit trails often translate into a premium during negotiations because they shorten buyer integration and compliance timelines.

Sector snapshots: SaaS, manufacturing, and retail impact patterns

SaaS: Buyers focus on recurring revenue metrics. Predictive wins that lift NRR, reduce churn, or increase ACV should be annualized and expressed as sustainable growth rates — those feed directly into higher EV/Revenue and EV/EBITDA multiples.

Manufacturing: Improvements in uptime, yield and throughput increase capacity without proportional capital spend. Translate gains into incremental output and margin expansion; for strategic acquirers this signals faster payback on capex and often higher multiples tied to operational leverage.

Retail & e‑commerce: Conversion lift, higher AOV and fewer stockouts improve both revenue and inventory carrying efficiency. Show how analytics shorten the cash conversion cycle and raise gross margins — metrics acquirers use to justify premium valuations in consumer and retail rollups.

How to present analytics-driven valuation uplift (simple playbook)

1) Baseline: document current ARR, gross margin, EBITDA and key operating metrics. 2) Isolate impact: use experiments/A–B tests to estimate realistic, repeatable lift for each KPI. 3) Translate to cash: convert KPI changes into incremental revenue or cost savings and compute incremental EBITDA. 4) Value uplift: apply conservative multiples (or run DCF scenarios) to incremental EBITDA or revenue to estimate enterprise value delta. 5) De-risk: attach confidence bands, sensitivity tables and evidence (test results, adoption metrics, security attestations) that buyers will probe.

Done well, this narrative turns pilots into boardroom language: credible experiments produce measurable KPIs, KPIs convert into incremental cashflow, and cashflow — backed by strong governance and security — converts into higher multiples. That is how predictive analytics stops being a technical project and becomes a value‑creation engine you can show to investors and acquirers.

Search & AI-Driven Analytics: Turn Natural Language Questions into Measurable Growth

Data teams and business folks alike have lived with the same frustration for years: dashboards are full of charts, but they rarely answer the real, messy questions people actually have. “How did churn change for this customer cohort after the last campaign?” or “Which tickets predict churn next month?” require pulling together multiple sources, translating business language into SQL, and waiting—often longer than the question remains relevant.

Search- and AI-driven analytics flips that script. Instead of filtering through dashboards or writing code, anyone can ask a natural-language question—plain English, not SQL—and get a grounded, explainable answer that links back to the data and actions. That means faster decisions, fewer meetings chasing the right report, and analytics that actually move the needle.

In this piece you’ll see what that looks like in practice: why search and AI aren’t replacements for your data stack but powerful complements; four real use cases that drive measurable results across customer service, marketing, sales, and operations; a quick way to check if your org is ready; and a pragmatic architecture and 30–60–90 rollout plan that proves ROI.

If you care about turning everyday questions into measurable growth—shorter time-to-answer, higher agent productivity, faster insights for marketers and sellers—keep reading. This introduction is just the start: the next sections will show the concrete steps and metrics you can use to make search + AI-driven analytics a real engine for growth in your org.

What search & AI-driven analytics really means (and why dashboards aren’t enough)

Organizations have long relied on dashboards and scheduled reports to monitor performance. Search- and AI-driven analytics reframes that model: instead of navigating rigid visualizations, teams ask questions in natural language, follow lines of inquiry, and get answers that are contextual, explainable, and action-ready. This shift changes who can get insights, how fast they arrive, and what teams can do with them.

From keyword filters to natural language and agentic analytics

Traditional search in analytics tools relies on filters, tags, and exact-match keywords. Natural language search lets users express intent—“Which product categories lost retention last quarter and why?”—and returns synthesized answers rather than lists of charts. Under the hood this combines semantic indexing (so related concepts are found even when words differ) with models that can summarize trends, surface anomalies, and explain drivers.

Agentic analytics goes one step further: an AI agent can run follow-up queries, combine multiple data sources, and even trigger workflows (for example, flagging a customer cohort for outreach). That turns analytics from a passive library into an interactive collaborator that helps teams close the gap between insight and action.

Search-driven vs. AI-driven: complementary roles, not substitutes

Think of search-driven analytics as widening access: it makes the right data discoverable across silos and empowers more people to ask questions. AI-driven analytics focuses on reasoning—connecting dots, summarizing evidence, and prioritizing what matters. Together they accelerate decision-making in ways neither could alone.

In practice, search surfaces the relevant datasets and documents quickly; AI layers on interpretation, causal hints, and recommended next steps. This complementary stack preserves the precision of structured queries while adding the flexibility of conversational discovery and the efficiency of automation.

The end of static dashboards: speed, context, and explainability win

Dashboards are valuable for monitoring known metrics, but they’re static by design: predefined views, fixed refresh cycles, and limited context. Modern decision-making demands three things dashboards struggle to deliver quickly—speed (instant answers on new questions), context (why a metric moved), and explainability (how the system reached a conclusion).

Search and AI-driven approaches deliver freshness by querying live sources, surface context by linking signals across product, CRM, tickets, and logs, and provide explainability through provenance—showing the data, filters, and reasoning steps behind an answer. That traceability is essential for trust and for handing insights to operators who must act (sales reps, CS teams, ops engineers).

By moving beyond static panels to conversational, explainable analytics and autonomous agents that can execute simple tasks, organizations gain the agility to respond faster and more precisely. To see how this plays out in concrete business scenarios—where these capabilities generate measurable impact—we’ll walk through practical use cases next.

Four use cases that move the needle

Customer service: search over the knowledge base + GenAI agent = 80% auto-resolution, 70% faster replies

Customer service teams are a natural first adopter of search + AI-driven analytics because they face high-volume, repetitive questions and need fast, consistent answers. Indexing knowledge bases, ticket histories, and product docs with semantic search lets agents (and customers via self-service) retrieve the exact context they need. Layer a GenAI agent on top and you get synthesized responses, context-aware follow-ups, and automated resolution workflows that reduce manual work and speed outcomes.

“80% of customer issues resolved by AI (Ema).” KEY CHALLENGES FOR CUSTOMER SERVICE (2025) — D-LAB research

“70% reduction in response time when compared to human agents (Sarah Fox).” KEY CHALLENGES FOR CUSTOMER SERVICE (2025) — D-LAB research

Voice of customer for marketing: unify tickets, reviews, and social to lift revenue (+20%) and market share (+25%)

Marketing gains when feedback streams are unified into a single, searchable layer. Combining tickets, reviews, and social chatter with semantic analytics surfaces high-impact product issues, feature requests, and brand sentiment—then AI summarizes themes and prioritizes what will move revenue and market share. That turns scattered feedback into concrete product and campaign levers.

“20% revenue increase by acting on customer feedback (Vorecol).” KEY CHALLENGES FOR CUSTOMER SERVICE (2025) — D-LAB research

“Up to 25% increase in market share (Vorecol).” KEY CHALLENGES FOR CUSTOMER SERVICE (2025) — D-LAB research

AI-assisted sales: query CRM and content on the fly; cut manual tasks 40–50% and accelerate revenue

Sales teams waste hours on CRM updates, research, and content assembly. A conversational layer that can query CRM records, surface case studies or pricing rules, and draft tailored outreach in seconds changes the math: reps spend more time selling and less time on admin. Integrations can also let AI log activities back to the CRM and recommend next best actions, shortening cycle times and increasing conversion.

“40-50% reduction in manual sales tasks.” B2B Sales & Marketing Challenges & AI-Powered Solutions — D-LAB research

“30% time savings by automating CRM interaction (IJRPR).” B2B Sales & Marketing Challenges & AI-Powered Solutions — D-LAB research

“50% increase in revenue, 40% reduction in sales cycle time (Letticia Adimoha).” B2B Sales & Marketing Challenges & AI-Powered Solutions — D-LAB research

Security and ops: search + AI for faster root cause, policy compliance, and fewer incidents

Operational teams and security engineers benefit from a searchable, semantic layer over logs, runbooks, incident reports, and policy docs. Natural language queries surface correlated alerts and historical fixes quickly; AI can suggest probable root causes, recommended remediations, and the exact runbook steps. That reduces mean time to resolution, speeds compliance checks, and helps triage noisy alert streams into prioritized action items.

These four examples show how search and AI together convert scattered data into immediate business impact—cutting time-to-answer, automating repetitive work, and surfacing revenue and risk signals. Next we’ll help you translate these opportunities into a practical readiness checklist and a small, high-impact pilot plan to prove value fast.

Assess your readiness for search & AI-driven analytics

Quick diagnostic: data sources, semantic coverage, workflows, and governance gaps

Start with a short, focused inventory—list the data sources you need (CRM, tickets, product telemetry, reviews, docs), note their owners, how often they’re updated, and whether they’re structured or unstructured. A reliable pilot needs accessible, reasonably fresh data more than perfect completeness.

Evaluate semantic coverage: do your business terms, metrics, and product names exist in a single place (a lightweight glossary or semantic model)? If not, expect extra time mapping synonyms, aliases, and common abbreviations so search and embeddings return meaningful results.

Map the workflows that will consume insights: who asks questions today, what decisions follow, and which systems must be updated automatically (helpdesk, CRM, alerting tools)? Pinpoint where answers should become actions so your pilot can close the loop—don’t treat analytics as read-only.

Audit governance and security gaps early: access controls, role-based visibility, PII handling, and basic audit trails are the minimum. Decide whether sensitive content will be excluded from embeddings or anonymized before ingestion, and identify a human-in-the-loop process for reviewing automated recommendations.

Finally, assess organizational readiness: identify an executive sponsor, a product/ops owner, and at least one subject-matter champion per function. Without cross-functional ownership, pilots stall even when the tech works.

Pilot scope: the 5 high-value questions to answer first

Choose a narrow pilot that answers business questions with clear outcomes. Five practical, high-impact questions to validate value quickly:

1) What are the top reasons for the last 200 support escalations and which fixes would reduce repeat tickets? Why it matters: reduces workload and improves CSAT. Success criteria: repeat-ticket rate down, average handle time reduced.

2) Which recent customer feedback themes signal churn risk or an upsell opportunity? Why it matters: prioritizes retention and revenue motions. Success criteria: prioritized playbooks triggered; measurable changes in churn/renewal behavior for targeted cohorts.

3) Which open deals show high intent based on CRM signals plus external intent data, and what message has historically moved similar accounts? Why it matters: focuses reps on higher-probability opportunities. Success criteria: conversion rate improvement and shorter sales cycle for flagged deals.

4) When an operational alert fires, what historical incidents and runbook steps resolved similar problems most quickly? Why it matters: reduces mean time to resolution and costly downtime. Success criteria: reduced MTTx and fewer escalations to senior engineers.

5) Which product features or documentation gaps generate the most customer confusion and how should content be updated? Why it matters: improves adoption and reduces support load. Success criteria: lowered content-related tickets and improved feature adoption metrics.

For each question define the minimal datasets to connect, a one-page success metric, and a 4–6 week timeline. Keep scope tight: two data sources and one downstream integration are often enough to prove the model.

With this diagnostic and a compact pilot plan, you can move from abstract potential to measurable outcomes—next you’ll translate the pilot needs into a lightweight architecture and governance plan that makes those outcomes reliable and repeatable.

Thank you for reading Diligize’s blog!
Are you looking for strategic advise?
Subscribe to our newsletter!

A proven architecture: from semantic layer to secure, explainable AI

Data foundation: connect your lakehouse/warehouse (Snowflake, Redshift, Databricks) and keep ELT simple

Start with a pragmatic data fabric: connect two or three high-value sources into your lakehouse or warehouse (examples: Snowflake, Redshift, Databricks) and prioritise reliable, incremental ingestion over one-off bulk lifts. Keep ELT pipelines simple, idempotent, and observable so you can prove freshness quickly.

Key patterns: canonical staging tables for raw data, transformation layers that produce trusted business tables, lightweight CDC or streaming for near‑real‑time needs, and automated lineage so every analytic answer can be traced to its source. Apply strong access controls at the storage layer and minimize the blast radius by scoping which tables are exposed to downstream semantic and retrieval systems.

Semantic model: business terms, metrics, row-level security, and PII policies

The semantic layer is the glue that turns raw tables into business-ready answers. Define a concise glossary of business terms and canonical metrics (e.g., active user, revenue, churn) and persist mappings from semantic concepts to underlying tables and columns. Keep these mappings versioned and testable so queries produce stable, auditable results.

Embed governance into the semantic model: enforce row-level security so users only see allowed slices, codify PII masking and redaction rules, and publish data contracts that specify SLA, freshness, and owner. A lightweight semantic service that exposes consistent field names and metric definitions reduces ambiguity for both human users and downstream AI agents.

Retrieval + reasoning: vector search, RAG, prompt templates, and function calling for live actions

Combine retrieval and reasoning: index documents, transcripts, product docs, and selected tables as vectors for semantic search, and pair that retrieval layer with reasoning models that synthesize, explain, and recommend. Retrieval-augmented generation (RAG) ensures answers are grounded in specific pieces of evidence rather than free-form hallucination.

Operationalize the reasoning layer with reusable prompt templates, clear grounding signals (source snippets and links), and deterministic post-processing for numeric outputs. Where automation must act, expose safe function-calling endpoints (for example: update a ticket, tag a CRM record, run a diagnostic) and ensure every action has a confirmation step and an audit trail so humans retain control.

Trust by design: SOC 2, ISO 27002, NIST 2.0, audit trails, and human-in-the-loop explanations

Security and trust are non-negotiable. Build layered defenses—encryption in transit and at rest, identity and permission management, logging, and anomaly detection—and align controls to recognised frameworks appropriate for your industry. Maintain model and data versioning so you can reproduce answers and investigate incidents.

Explainability and human oversight are central to adoption: attach provenance metadata to every AI answer (which sources were used, which prompt templates, model version), surface confidence scores, and route low-confidence or high-risk outcomes to a human reviewer. Regularly monitor for data drift, model drift, and feedback loops, and implement a lightweight process for red-teaming and remediating problematic behaviours.

When these layers—solid data foundations, a governed semantic model, robust retrieval+reasoning, and trust controls—work together, search- and AI-driven analytics becomes a reliable, repeatable capability rather than an experimental toy. Next, translate this architecture into a short rollout plan and measurable KPIs so stakeholders can see value in weeks, not months.

30–60–90 day rollout and the KPIs that prove ROI

Day 0–30: connect two sources, define a lightweight semantic layer, ship instant answers to 5 key questions

Objectives: prove connectivity and demonstrable value quickly. Choose two high-impact sources (for example, support tickets + product telemetry or CRM + knowledge docs) and build reliable ingestion with basic transformation and freshness checks.

Deliverables: a minimal semantic layer (glossary + mappings for 8–12 core fields), a searchable index for documents and rows, and a small set of prompt templates that answer the five pilot questions defined earlier.

Roles & cadence: an engineering lead for data pipelines, a product/analytics owner to define the semantic terms, and a weekly stakeholder demo to capture feedback and refine intent handling.

Day 31–60: pilots in customer service and sales; embed in helpdesk/CRM; track CSAT and time-to-answer

Objectives: embed the conversational/search surface where people work and measure behavioural change. Roll the pilot into a live helpdesk widget and a sales enablement chat so agents can test answers and log actions back to systems.

Deliverables: integrations that push validated outputs to helpdesk/CRM, a lightweight human-in-the-loop review workflow for low-confidence responses, and a dashboard showing adoption and early impact metrics.

Operational best practices: implement feedback capture at the point of use (thumbs up/down, quick notes), tune retrieval relevance and prompts based on real queries, and enforce access controls and redaction for sensitive fields.

Day 61–90: scale to marketing and ops; add agents for proactive insights; enable governance reviews

Objectives: expand to additional teams, introduce proactive agents that push alerts or recommendations, and operationalize governance for safety and compliance reviews.

Deliverables: new connectors (reviews, social, logs) added to the semantic layer, scheduled agents that surface opportunities (e.g., rising churn signals, high-intent leads), and a governance board that reviews model performance, provenance logs, and security reports on a biweekly cadence.

Scale considerations: automate model and data-version tagging, standardize audit trails for every action, and formalize escalation rules so agents can hand off complex or risky cases to humans.

KPIs to track: CSAT, resolution time, deflection rate, churn/NRR, pipeline velocity, AOV, adoption, freshness, incident rate

Choose a small set of primary KPIs tied to the pilot’s business outcomes and a few health metrics for platform reliability. Primary KPIs should map directly to revenue or cost outcomes (examples: time-to-first-response, conversion uplift for flagged deals, churn reduction in targeted cohorts).

Platform & trust metrics: track adoption (active users, queries per user), answer precision/acceptance (feedback rate and human overrides), freshness (time since last ingestion), and incident rate (errors, failed updates, or hallucination flags).

Measurement approach: baseline every KPI for at least two weeks before changes, run A/B or cohort tests where possible, and report weekly for the first 90 days with clear success thresholds (e.g., X% adoption within 30 days, Y% reduction in time-to-answer by day 60).

Financial translation: translate operational gains into dollar or time savings for stakeholders—estimate agent-hours saved, incremental revenue from faster conversions, or cost avoided from fewer escalations—so the ROI story is concrete and auditable.

Patient care optimization: a 90-day plan to improve access, outcomes, and staff well-being

If your clinic or unit feels stretched thin — long waits, fragile throughput, and a team that’s running on empty — you’re not imagining it. The strain shows up in patients waiting longer for care and in the people delivering that care. In 2023, nearly half of physicians (48.2%) reported at least one symptom of burnout, a reminder that improving access and outcomes has to include staff well‑being too (AMA, 2024).

This post gives a practical, no‑fluff 90‑day plan you can use right away: measure where you are, run a couple of focused pilots, then scale what works. We’ll focus on three connected goals — faster, fairer access for patients; safer, more reliable outcomes; and less grind for your people — and show simple metrics to watch so you know you’re making progress.

Why 90 days? It’s long enough to gather a meaningful baseline and short enough to keep momentum. In weeks 1–2 you’ll pull baseline EHR, call‑center, and billing data; weeks 3–6 you’ll test targeted fixes (scheduling templates, staffing tweaks, discharge huddles, small AI pilots); and weeks 7–12 you’ll scale the wins and lock in governance and guardrails. Along the way we track clear KPIs — access (wait times/no‑shows), outcomes (LOS/readmissions/PROMs) and experience (patient and staff measures) — so the work stays practical, not theoretical.

Start with clarity: what patient care optimization means and how to measure it

The triple win: timely access, safer outcomes, better experience

Patient care optimization is the practical translation of the Triple Aim: improve the experience of care (access and reliability), improve health outcomes, and reduce per-capita cost—now often framed alongside workforce well‑being as the Quadruple Aim. Framing optimization this way keeps goals aligned: faster, safer, more person-centered care delivered by a sustainable workforce. For definitions and the framework, see the Institute for Healthcare Improvement’s Triple Aim resources: IHI — Triple Aim and the IHI topics overview that highlights outcomes, experience, access, and workforce well-being: IHI — Improvement Topics.

Metrics that matter: wait time, LOS, readmissions, PROMs, staff burnout

Measure what matters. At the system and service line level prioritize: (1) access metrics — appointment wait time (request-to-visit and arrival-to-provider); (2) clinical outcomes — length of stay (LOS) and condition‑specific outcomes; (3) safety and utilization — 30‑day unplanned readmissions (standardized definitions available from CMS); (4) patient-reported outcome measures (PROMs) to capture recovery and function (use ICHOM standard sets where possible); and (5) workforce well‑being/burnout using validated instruments such as the Maslach Burnout Inventory (MBI). For the official 30‑day readmission definitions and measurement approach see CMS: CMS — Readmissions. For PROMs standards and condition sets, see ICHOM: ICHOM — Outcome Sets. For validated burnout tools, see Maslach Burnout Inventory resources: Maslach Burnout Inventory.

To underline urgency, recent D‑Lab research highlights how workforce strain and administrative burden are already squeezing care delivery: “50% of healthcare professionals experience burnout, leading to reduced job satisfaction, mental and physical health issues, increased absenteeism, reduced productivity, lower quality of patient care, medical errors, and reduced patient satisfaction. Additionally, clinicians spend 45% of their time using Electronic Health Records (EHR) software, limiting patient-facing time and prompting after-hours “pyjama time”. Besides that, administrative costs represent 30% of total healthcare costs” Healthcare Industry Challenges & AI-Powered Solutions — D-LAB research

Baseline in 2 weeks: pull EHR, call-center, and billing data

Set a two‑week sprint to establish a reliable baseline: extract the minimal canonical datasets, validate them, and publish a one-sheet dashboard. Key steps:

1) Define and extract: pull appointment logs and scheduling templates (timestamps for request, booking, arrival, provider start); EHR encounter data (diagnosis, procedure, admission/discharge timestamps for LOS); admission/discharge and readmission flags; PROMs responses if collected; call‑center logs (volume, hold time, abandonment); and billing/claims error rates. For guidance on consistent operational metric definitions and quality checks see FASStR and other operational-metrics frameworks: FASStR — operational metrics and scheduling/measurement advice from the National Academy of Medicine: NAM — Scheduling metrics.

2) Validate and reconcile: cross-check counts (scheduled vs. arrived vs. billed), inspect outliers (extreme wait times or LOS), and compute initial KPIs: median and 95th percentile wait times, average LOS and LOS by case‑mix, risk‑adjusted 30‑day readmission rate, completion rate and mean score for chosen PROMs, and baseline burnout scores (MBI or similar).

3) Visualize and prioritize: publish a one‑page dashboard that highlights the biggest gaps (e.g., clinics with long request-to-visit delays, service lines with high readmissions, units with high administrative error rates). Use those gaps to pick the first pilot areas.

With clear definitions and a validated two‑week baseline you’ll be equipped to move from measurement to action—retooling schedules, staff assignments, and throughput processes so that access, outcomes, and team well‑being all improve together.

Fix the flow: scheduling, staffing, and bed management grounded in operations science

Front-door redesign: demand forecasting, template optimization, no-show reduction

Start by treating the clinic front door as a supply‑demand problem: map requests by day/time, by reason-for-visit, and by clinician productivity for 8–12 weeks to reveal true demand patterns. Use those patterns to right‑size appointment templates (mix of same‑day, short follow‑up, and new‑patient slots) and reserve capacity for predictable peaks. The advanced‑access/open‑access model and template redesign reduce backlog and ED diversion when applied with continuous improvement: see practical guidance and evidence from the advanced access literature and scheduling best‑practice syntheses (Advanced Access synthesis — PMC, Building from Best Practices — NCBI Bookshelf).

Pair templates with predictive no‑show models and behaviorally informed outreach. Machine‑learning models plus SMS/voice reminders and targeted outreach to high‑risk patients cut missed appointments; randomized and systematic reviews show consistent reductions when reminders and targeted interventions are used (Predictive no‑show interventions — PMC, Reminder systems review — PubMed). Practical tactics: modest overbooking guided by no‑show probability, automated two‑way reminders, early outreach for high‑complexity visits, and a small same‑day reserve to absorb cancellations.

Right staff, right time: dynamic staffing and patient assignment

Move from fixed rosters to acuity- and demand‑driven staffing. Implement a simple acuity tool (+ real‑time census dashboard) that translates patient needs into staffed minutes; combine that with a flexible float pool and documented cross‑coverage rules. Studies show better outcomes and efficiency when staffing matches patient acuity and when assignment is optimized with data‑driven tools (Nurse staffing and outcomes review — PMC, Optimising Nurse–Patient Assignments — PMC).

Operationalize dynamic assignment by: (1) publishing a simple acuity-to-nurse ratio table, (2) running twice‑daily staffing huddles to adjust assignments, (3) using predictive models to flag expected surges 4–12 hours ahead, and (4) keeping a 1–2 FTE flexible pool for predictable peaks. Track fill rates, overtime, and patient acuity mismatch as KPIs.

Throughput levers: discharge-before-noon, daily huddles, escalation rules

Throughput is a system property: upstream scheduling + downstream capacity must be managed together. Three high‑impact operational levers are reliable discharge planning, short daily huddles, and explicit escalation rules for bed assignment and cleaning teams.

Discharge‑by‑noon initiatives can free morning beds and reduce ED boarding when paired with upstream planning; evidence is mixed but quality improvement projects and multi‑year implementations show sustained bed availability gains when process changes are embedded (see implementation studies and QI reports: Increasing and sustaining discharges by noon — PMC, Discharge Before Noon initiative — Joint Commission Journal).

Daily interdisciplinary huddles focused on prioritized discharges, pending diagnostics, and bed readiness shorten decision cycles and reduce handoff delays. Systematic reviews and toolkits show improved communication and measurable flow gains from short, structured huddles (Huddle effectiveness — PMC, AHRQ huddle component kit).

Create clear escalation rules (who authorizes extended hours for housekeeping, who moves a patient for rapid turnover, thresholds for stepping up staffing) and measure time-to-bed-ready and bed turnaround time. These simple operational playbooks convert daily variability into predictable shifts you can staff for.

Perioperative boosts: prehab and senior optimization to cut complications

Perioperative optimization (prehabilitation and geriatric assessment for older adults) reduces complications, shortens LOS, and lowers readmission risk when bundled and started early. Randomized and multicenter trials of multimodal prehabilitation show improved functional recovery and fewer complications in older surgical patients (Multimodal prehabilitation RCT, PREHAB trials and reviews — PMC).

Operational steps: screen elective surgery patients for frailty and high‑risk features at scheduling; enroll eligible patients in a 2–4 week multimodal prehab bundle (exercise, nutrition, smoking/alcohol counseling, medication review); coordinate a perioperative optimization clinic for seniors with anesthesia and geriatrics input (models like POSH illustrate team‑based perioperative care). Measure cancellations, complication rates, LOS, and PROMs to quantify ROI.

All of these flow fixes require reliable, short‑cycle measurement and a governance rhythm (weekly flow dashboard, daily huddles, and clear escalation). They also set the stage for targeted automation: when appointment patterns, no‑show risks, staffing needs, and discharge bottlenecks are instrumented, automation and ambient tools can remove administrative drag and free clinicians to focus on care—turning operational improvements into sustainable gains. “50% of healthcare professionals experience burnout, leading to reduced job satisfaction, mental and physical health issues, increased absenteeism, reduced productivity, lower quality of patient care, medical errors, and reduced patient satisfaction…Clinicians spend 45% of their time using Electronic Health Records (EHR) software, limiting patient-facing time and prompting after-hours “pyjama time”…Administrative costs represent 30% of total healthcare costs…No-show appointments cost the industry $150B every year.” Healthcare Industry Challenges & AI-Powered Solutions — D-LAB research

Cut administrative drag with AI that already works

Ambient scribing: 20% less EHR time, 30% less after-hours work

Ambient digital scribing captures the clinical conversation and drafts structured notes directly into the EHR, trimming documentation time and after‑hours charting. Early adopter reports and peer‑reviewed pilots show measurable reductions in clinician EHR time and burnout risk — an important capacity win when clinicians currently spend large portions of their day in the chart (News‑Medical summary of scribe pilots).

Smart scheduling and billing: 38–45% admin time saved, 97% fewer bill coding errors

AI scheduling and automated billing engines reduce repetitive admin tasks: intelligent reminders, no‑show scoring, automated insurance eligibility checks, and machine‑assisted coding that suggests CPT/ICD mappings. Real‑world deployments report large time savings for administrative teams and dramatic reductions in coding errors, which translates to faster, more accurate claims and fewer denials.

For context on the size of the administrative burden and the potential savings from automation, see CAQH and Health Affairs analyses of administrative waste and electronic prior authorization gains (CAQH Index, Health Affairs — administrative waste).

Eligibility, prior auth, and referrals: automate the busywork

Prior authorization, benefit verification, and referral routing are high‑frequency tasks that create delays and call‑center load. End‑to‑end automation (electronic benefit checks, ePA integration, rule‑based approvals plus human‑in‑the‑loop review for edge cases) shortens turnaround, reduces manual appeals, and improves patient access. Vendor platforms and payer‑facing networks (Surescripts, ePA vendors) show concrete reductions in days‑to‑approval and fewer manual escalations (Surescripts — ePA, AKASA — prior authorization automation).

Broader analyses estimate large potential savings from standardized, automated prior authorization workflows and fewer administrative hours spent on phone calls and faxes (CAQH — ePA adoption & benefits).

Pilot playbook: pick 1–2 clinics, measure, then scale

Run a tightly scoped pilot that pairs a clinician champion with an operations lead and IT. Keep pilots short (6–8 weeks active + 2 weeks baseline) and outcome‑oriented. Core steps:

1) Select sites with measurable pain (high documentation time, frequent denials, heavy call‑center load).

2) Define baseline KPIs: clinician EHR time (in‑visit & after hours), admin FTE hours, claim denial rate, prior‑auth turnaround, patient no‑show rate, and staff satisfaction.

3) Deploy minimum viable integrations: ambient scribe for a small group of clinicians, automated scheduling + reminders for high‑no‑show clinics, and an eligibility/ePA connector for the busiest service line.

4) Measure fast: run weekly dashboards, collect qualitative clinician feedback, and quantify ROI (time saved × hourly cost, reduction in denials, improved throughput).

5) Iterate and scale: document integration work, consent/security checklist, and a training playbook; expand to other clinics after 1–2 validated wins.

When administrative drag is reduced, clinicians regain time for patient care and organizations unlock capacity to expand access and higher‑value services — a prerequisite to shifting resources toward remote triage, continuous monitoring, and intelligent decision support that proactively prevent admissions and speed recovery.

Thank you for reading Diligize’s blog!
Are you looking for strategic advise?
Subscribe to our newsletter!

Bring care closer: virtual-first pathways and decision support

Virtual triage and telehealth to shorten waits and widen access

Make virtual care the default entry point for low‑complexity complaints and routine follow‑ups: an integrated virtual triage layer routes patients to self‑care guidance, automated scheduling, telehealth visits, or urgent in‑person evaluation based on risk. Systematic reviews and implementation studies show telemedicine can shorten wait times and reduce time‑to‑consult for many specialties when triage and workflows are designed end‑to‑end (Reducing outpatient wait times through telemedicine — PMC, How Virtual Triage Can Improve Patient Experience — PMC).

Patient adoption and clinician acceptance are high where access improves and workflows are simple. As D‑Lab observed, “Telehealth surged by 38x during the pandemic and is now stabilizing as a mainstream channel for patient treatment, with 82% of patients expressing preference for a hybrid model (combination of virtual and in-person care), and 83% of healthcare providers endorsing its use” Healthcare Trends Driving Disruption in 2025 — D-LAB research

Remote Patient Monitoring (RPM) that prevents admissions and readmissions

Target RPM to high‑risk cohorts (heart failure, COPD, post‑op patients, complex chronic disease). Effective RPM programs combine devices, automated alerts, and a clinical response pathway — not just data collection. Recent systematic reviews and meta‑analyses report that RPM can reduce hospital admissions and readmissions for selected populations, though effectiveness varies by program design and engagement (Does RPM reduce acute care use? — BMJ Open, Factors influencing RPM effectiveness — PMC).

High‑impact pilots pair RPM with clear escalation rules and rapid response teams; D‑Lab highlights striking COVID‑era results: “…78% reduction in hospital admissions when COVID patients used Remote Patient Monitoring devices (Joshua C. Pritchett)…” Healthcare Trends Driving Disruption in 2025 — D-LAB research

Diagnostic AI for imaging and triage—with guardrails

Use diagnostic AI to accelerate reading, triage urgent studies, and surface high‑probability findings for faster clinician review. Radiology triage tools and CAD systems can shorten time to diagnosis and prioritize worklists, but they must be deployed with transparency, performance monitoring, and clinician‑in‑the‑loop workflows. The FDA and professional societies recommend premarket evidence, post‑market surveillance, and human oversight for AI used in clinical decision support (FDA guidance — predetermined change control plans, 2025 Watch List: AI in Health Care — NCBI).

Clinical results are promising in specific tasks: D‑Lab reports examples such as “99.9% diagnosis accuracy for instant skin cancer diagnosis with just an iPhone” Healthcare Trends Driving Disruption in 2025 — D-LAB research. Operationalize AI pilots with local validation, thresholding for sensitivity/specificity appropriate to the use case, and a clear escalation path for discordant cases.

Safety, equity, and ROI: governance plus a simple 90-day rollout

Cybersecurity and privacy-by-design protect patient trust

Security and privacy are not optional—they are the precondition for any digital or AI-enabled improvement. Start with a concise risk register, an asset inventory (devices, data flows, third‑party services), and a prioritized remediation plan for high‑impact gaps (access control, patching, backups, network segmentation). Follow established healthcare and AI security guidance: HHS/ASP R guidance and HIPAA risk analysis tools for protected health information, NIST’s Cybersecurity Framework and AI Risk Management Framework for algorithmic risk, and FDA device‑cybersecurity recommendations for connected medical devices (HHS — Risk Analysis, HPH Sector CSF Implementation Guide, NIST — AI RMF, FDA — Cybersecurity).

Operational controls matter: encryption at rest/in transit, least‑privilege IAM, multi‑factor authentication, vendor security attestations, and tested incident response playbooks. Regular tabletop exercises with clinical, IT, legal, and communications teams compress learning and reduce time‑to‑recovery in real incidents.

As D‑Lab warns, “Rapid digitalization improves outcomes but heightens exposure to ransomware, data breaches, and regulatory risk – making healthcare a top target for cyberattacks” Healthcare Industry Challenges & AI-Powered Solutions — D-LAB research

Bias, safety, and clinician‑in‑the‑loop guardrails

Governance for AI and decision support must address fairness, safety, and human oversight from day one. Require pre-deployment validation on local, representative data; document performance across demographic groups; define acceptable operating points (sensitivity/specificity) tied to clinical workflows; and mandate clinician review for edge or high‑risk cases. Use NIST and OECD responsible‑AI frameworks and follow FDA expectations for clinical evaluation and post‑market monitoring (NIST — Managing Bias, OECD — Responsible AI in Health, FDA — AI/ML in Medical Devices).

Practical guardrails: (1) apply clinician acknowledgement for algorithmic recommendations on high‑risk decisions; (2) deploy explainability summaries and confidence intervals in the UI; (3) log decisions, overrides and outcome linkage for continuous validation; and (4) set an alerting cadence for drift detection (model performance drops or data distribution shifts).

Track fairness and safety KPIs (performance by subgroup, false‑positive/negative rates, override frequency, and clinical outcome concordance) and tie them to a governance committee with clinical, legal, equity, and IT representation.

90‑day plan: weeks 1–2 baseline, 3–6 pilots, 7–12 scale

Use a simple, repeatable 90‑day playbook that balances rapid results and risk management:

Weeks 1–2 (Baseline): assemble a small steering group, define success metrics, and pull canonical datasets (scheduling logs, EHR timestamps, call‑center volumes, claims denials, security posture snapshot). Publish a one‑page baseline dashboard so everyone agrees on current performance.

Weeks 3–6 (Pilots): run 1–2 controlled pilots (examples: ambient scribe for 5 clinicians, automated scheduling in one clinic, RPM for a high‑risk cohort). Apply PDSA/rapid‑cycle testing, collect weekly KPIs, and capture qualitative feedback from clinicians and patients. Include security review and fairness checks before any pilot goes live.

Weeks 7–12 (Scale & embed): iterate on pilot fixes, build required integrations and training materials, codify governance (approval, monitoring, and incident escalation), and expand to additional sites if KPIs show net benefit and no safety/equity regressions.

Use small, measurable scopes for pilots to preserve clinician time, accelerate learnings, and minimize supply‑chain or interoperability surprises. IHI’s Model for Improvement and PDSA cycles are practical foundations for this cadence (IHI — Model for Improvement).

AI-Driven Business Intelligence: Revenue, Efficiency, and Valuation Uplift

AI-driven business intelligence is no longer a niche experiment or a set of flashy visuals — it’s the thread that ties revenue, efficiency, and company valuation together. Instead of waiting for monthly reports, teams can spot anomalies in real time, predict which customers are likely to churn, recommend the next best offer, and price dynamically — all from the same intelligence layer. That changes how growth and risk look to operators and buyers alike.

This article walks through what that shift means in practical terms: where AI outperforms legacy dashboards, the revenue levers you can pull, the operational and margin wins that follow, how to protect value with governance, and a tight 90‑day plan to get an AI‑driven BI program live. Expect clear examples, realistic outcomes, and the specific metrics you’ll want to track.

Why this matters now

Companies that connect AI to business workflows stop treating intelligence as a reporting problem and start treating it as an operating advantage. That leads to faster decisions, fewer surprises, and measurable changes in retention, deal size, and cost to serve — which in turn make the business easier to value. This article is for leaders who want the how, not the hype: how to pick the first use cases, measure impact, and keep risk under control.

What you’ll get from the next sections

  • Concrete examples of where AI adds the most value (anomaly detection, forecasting, root‑cause).
  • Revenue playbooks: improving retention, increasing average order value, and boosting close rates.
  • Operational wins that move margins: predictive maintenance, smarter supply planning, and automation.
  • Practical guidance on governance, explainability, and data contracts so your AI becomes an asset, not a liability.
  • A focused 90‑day launch plan with checkpoints you can use on Monday morning.

Read on if you want a straightforward map from AI experiments to measurable business outcomes — and a simple path to show those outcomes to investors, boards, and teams.

What AI-driven BI means now—and why it beats legacy dashboards

From descriptive to predictive and prescriptive loops

Traditional dashboards summarize what happened. Modern AI-driven BI closes the loop: it detects patterns in historical data, predicts what will happen next, and prescribes exactly which actions will improve outcomes. That means moving from static charts to continuous decision loops where models generate forecasts, trigger alerts, and recommend prioritized actions — all updated as new data arrives.

Practically, this reduces decision latency and moves teams from reactive firefighting to proactive value capture: fewer surprises, faster interventions, and more predictable performance against KPIs.

Generative AI for self-serve questions and better data stories

Generative models let non-technical users ask business questions in plain language and receive concise, context-aware answers: “Why did ARR dip in EMEA?” or “Show the ten accounts most likely to churn this quarter.” These answers come with natural-language narratives, suggested visualizations, and next‑best actions—so insights are not just visible, they’re actionable.

Embedding generative BI into workflows converts insight discovery from an analyst-driven bottleneck into a self-serve capability that scales across product, sales, and ops teams, accelerating adoption and ROI.

Where AI excels: anomaly detection, forecasting, and root cause

AI outperforms static rule sets at three repeatable tasks: catching subtle anomalies in noisy streams, producing calibrated forecasts across horizons, and accelerating root-cause analysis by correlating signals across disparate data sources. That means earlier detection of revenue leakage, more accurate demand forecasts, and faster identification of the upstream cause when KPIs move.

Because these capabilities are always-on and probabilistic, they create prioritized, confidence-scored insights (not noise), enabling teams to focus on the handful of issues that materially affect margins and growth.

Why this raises valuation multiples

AI-driven BI changes the risk and growth profile buyers pay for. By making revenue streams more predictable, closing more deals, and cutting churn and costs, it de-risks future cash flows and expands both EV/Revenue and EV/EBITDA multiples. Consider the concrete outcomes that implementations deliver:

“AI-enabled improvements translate directly into valuation uplift: implementations have driven up to ~50% revenue increases, ~32% improvements in close rates, double-digit AOV gains, and ~30% reductions in churn — outcomes that expand EV/Revenue and EV/EBITDA multiples by de-risking growth and improving margins.” Portfolio Company Exit Preparation Technologies to Enhance Valuation. — D-LAB research

In short: better, faster decisions lead to higher retention, larger deals, and steadier growth — and investors pay a premium for that predictability.

These shifts are not academic: they require revisiting data architecture, instrumenting decision workflows, and pairing models with clear guardrails so insights reliably translate into commercial impact. With those building blocks in place, the path from insight to measurable value becomes repeatable — and that is what separates AI-driven BI from legacy dashboards.

Next, we’ll break down the concrete revenue levers and operational levers that capture these gains and the benchmarks teams should target to prove impact.

Revenue levers: retention, bigger deals, and smarter pipeline

Keep and grow customers with sentiment analytics and CS health

Retention is the highest-leverage lever: small improvements in churn compound across ARR and lift valuation. AI-driven sentiment analytics turn feedback, support transcripts, and product usage into health scores and risk signals, enabling targeted playbooks (renewal outreach, tailored feature nudges, or tailored commercial offers) before accounts slip. When customer success platforms combine product telemetry with open-text sentiment, teams move from reactive renewals to prioritized, proactive interventions that preserve and expand lifetime value.

Grow deal size with recommendations and dynamic pricing

Recommendation engines surface relevant upsell and cross-sell suggestions at the point of decision, increasing average order value and deal profitability. Combined with dynamic pricing that adjusts offers by segment, timing, and propensity-to-pay, teams capture incremental margin without diluting conversion. The practical approach: A/B test recommendation placements and price signals in sales motions, measure incremental AOV, then bake winning tactics into CPQ and commerce flows so increases become repeatable.

Grow deal volume with AI sales agents and buyer‑intent data

AI sales agents automate lead enrichment, qualification, and personalized outreach so reps focus on highest-value conversations. Buyer-intent platforms extend visibility beyond owned channels, surfacing prospects that are actively researching solutions. The result is a sharper, fuller pipeline and higher conversion efficiency—more qualified opportunities at a lower marginal CAC.

Benchmarks to aim for: churn −30%, close rate +32%, AOV +30%, revenue +10–50%

When you need concrete targets, use market outcomes from real implementations as a guide. For retention and CS:

“Customer Retention: GenAI analytics & success platforms increase LTV, reduce churn (-30%), and increase revenue (+20%). GenAI call centre assistants boost upselling and cross-selling by (+15%) and increase customer satisfaction (+25%).” Portfolio Company Exit Preparation Technologies to Enhance Valuation. — D-LAB research

And for sales and pricing uplifts:

“Sales Uplift: AI agents and analytics tools reduce CAC, enhance close rates (+32%), shorten sales cycles (40%), and increase revenue (+50%). Product recommendation engines and dynamic software pricing increase deal size, leading to 10-15% revenue increase and 2-5x profit gains.” Portfolio Company Exit Preparation Technologies to Enhance Valuation. — D-LAB research

Use these benchmarks as hypotheses: run short pilots, measure lift on key metrics (churn, close rate, AOV), and scale the tactics that produce consistent, repeatable ROI. With validated growth levers in place, the next challenge is converting those topline gains into durable margins and operational resilience so the business scales predictably.

Operations and margin: predictive, automated, always‑on

Predictive maintenance and digital twins to lift OEE

Swap calendar-based checklists for data-driven asset care. Predictive maintenance uses sensor streams and anomaly detection to forecast failures before they occur; digital twins let teams simulate fixes and run “what‑if” scenarios without interrupting production. Start by instrumenting a small set of critical assets, stream telemetry into a lightweight model, and route high-confidence alerts into an operator workflow so technicians act on prioritized work orders rather than chasing noise.

Design the feedback loop: alarms drive inspections, inspection outcomes retrain models, and model confidence metrics guide how much human verification is required. Over time this reduces unplanned downtime, smooths capacity, and turns maintenance from a cost center into a predictable lever for uptime.

Supply chain planning to cut risk and cost

Move from single-point forecasts to probabilistic, scenario-based planning. AI can combine demand signals, supplier risk indicators, and lead-time variability to recommend inventory buffers, alternative sourcing, and order timing that minimize stockouts and excess holding. Run scenario experiments using historical stress periods to validate recommendations before changing procurement rules.

Operationalize planning outputs by integrating them with procurement, production scheduling, and logistics systems so recommended changes become actionable decisions rather than static reports. The goal is fewer emergency shipments, more reliable fulfillment, and clearer trade-offs between cost and service.

Agents, copilots, and assistants to remove busywork at scale

Automate routine operational tasks—work order creation, first‑line triage, report generation—and surface only the exceptions that need human judgment. Co‑pilots embedded in operator UIs can suggest next steps, draft incident summaries, and pre-fill forms, cutting administrative friction and freeing skilled staff for high‑value problem solving.

Design these agents with clear escalation rules and audit trails. Human oversight at defined decision points keeps control while delivering the speed benefits of automation; instrument usage and accuracy metrics so the assistant improves with real interactions.

Metrics that matter: cycle time, unit cost, throughput, SLA hit rate

Choose a small set of operational KPIs that map directly to margin and capacity. Track cycle time end‑to‑end, unit cost by product or line, throughput against plan, and SLA hit rate for customer commitments. Make these metrics available in real time and tie them to the AI decision signals so you can see which model recommendations move the needle.

Use controlled pilots with A/B or cohort designs to prove causality: link interventions (a new maintenance policy, a planning rule, an assistant) to KPI deltas, capture remediation costs, and calculate payback. That measurement discipline turns executive optimism into investment-grade evidence.

When operations are instrumented, automated, and measured—then hardened into workflows—the final phase is to codify governance, IP protection, and auditability so efficiency gains become defensible, transferrable value during future growth or exit conversations.

Thank you for reading Diligize’s blog!
Are you looking for strategic advise?
Subscribe to our newsletter!

Trust and protection: turn IP, data, and governance into upside

Make models explainable and auditable, not a black box

Explainability is a commercial asset, not just a compliance checkbox. Document model intent, training data scope, inputs and outputs, and decision boundaries so stakeholders can understand what the model does and when it will fail. Build model cards and runbooks for every production model that describe assumptions, failure modes, and recommended human interventions.

Operationally, enforce versioning and immutable audit trails for training runs, model binaries, and deployment artifacts. Pair automated tests (accuracy, fairness, drift detection) with human review gates so changes to models require an accountable sign‑off before they influence customers or financial reporting.

ISO 27002, SOC 2, NIST 2.0—what to adopt and when

Security and privacy frameworks become value enablers when they align with business risk and customer expectations. Start by mapping which controls are most relevant to your data and customers, then phase adoption so you deliver high‑impact controls first (access management, encryption at rest/in transit, incident response) and follow with broader governance requirements.

Use framework milestones as external signals of maturity for customers and investors: a clear roadmap to achieve the right certifications or attestations is often as important as the certification itself. Treat the framework implementation as a product: scope, backlog, owners, and measurable milestones.

Data quality contracts and lineage inside your BI stack

Quality is the foundation of trustworthy BI. Define data contracts between producers and consumers that specify schema, freshness, and acceptable error rates. Surface lineage so every metric can be traced back to source systems and transformations — that traceability reduces time spent on investigations and speeds audits.

Automate monitoring: data‑quality checks, schema validation, and freshness alerts should feed operational workflows (tickets, runbooks, or remediation agents). When issues occur, the system should show the affected downstream metrics and recommended rollback or correction steps so business teams can act with confidence.

Privacy‑by‑design and bias checks with human oversight

Embed privacy and fairness considerations early in product and model design. Reduce the need for sensitive data by default (minimization, anonymization, synthetic substitutes) and establish review checkpoints for high‑risk features or audiences. Require documented justification whenever personal data is used to train or drive decisions.

Combine automated bias scans with domain expert review. When an automated check flags potential disparities, route the case to a multidisciplinary team (engineering, legal, product, and domain experts) that can investigate root causes and recommend concrete mitigations that balance business goals and rights protections.

Turn these practices into commercial differentiators: clear model documentation, demonstrable control frameworks, traceable data lineage, and privacy safeguards reduce transactional friction, speed due diligence, and make your AI investments easier to value. With trust and governance codified, the next step is to convert these policies into a prioritized rollout plan and fast pilots that prove impact in weeks rather than quarters.

A 90‑day plan to launch AI-driven business intelligence

Weeks 0–2: select 3 high‑ROI use cases and set KPI baselines

Kick off with executive alignment and a short, cross‑functional workshop to pick three use cases that are measurable, valuable, and feasible within 90 days. Score candidates by impact, confidence, and implementation effort; prioritise one revenue, one retention/experience, and one operational use case where possible.

Deliverables: one‑page use‑case briefs (owner, hypothesis, success metric), KPI baselines (historical data window), data owners list, and a simple project charter with sprint cadence and success criteria.

Weeks 3–6: wire data pipelines; prototype sentiment, pricing, or PM pilots

Build the minimum plumbing to feed prototypes: instrument missing events, establish ingestion to a staging layer, and implement basic ETL/transform jobs. Apply privacy‑by‑default (masking/minimisation) during ingest.

Run lightweight prototypes in parallel: a predictive model, a recommendation or pricing rule, and a sentiment/health score. Use fast iterations (daily/weekly) and shadow evaluation so prototypes don’t affect production decisions until validated. Track accuracy, business lift proxies, and data freshness as your core prototype metrics.

Weeks 7–10: embed in workflows; train teams; define guardrails

Move validated prototypes from demos into real workflows: wire model outputs into the tools users already use (CRM, ticketing, scheduling), and create concrete playbooks that specify who does what when the system flags an opportunity or risk.

Run focused training sessions and office hours for end users. Define governance: versioning, approval gates, fairness and privacy checks, escalation paths, and rollback criteria. Instrument monitoring (data drift, prediction confidence, adoption) and connect alerts to owners.

Weeks 11–12: go live; measure ROI; plan the next sprint

Start a phased rollout with control groups or A/B testing to measure causal impact on your prioritized KPIs. Compute simple business metrics (lift, conversion, churn change, cost savings), compare against baselines, and capture time to value and operational cost to operate the solution.

Close the sprint with a review packet: validated results, learned risks, recommended next use cases, and a 90‑day roadmap for scaling. Decide which models move to full production, which need another iteration, and which should be sunset.

Operational roles and ways of working

Staff the program with a clear sponsor, product owner, data engineer, data scientist/ML engineer, MLOps lead, domain SMEs, and a change manager. Use two‑week sprints, weekly demos with stakeholders, and a lightweight runbook for incidents and rollbacks.

Measurement discipline that scales

Insist on measurable hypotheses, control groups for attribution, and a small set of business KPIs tied to financial outcomes. Automate dashboards for both model health and business impact, and require a documented payback calculation before wider investment.

When the twelve weeks end you’ll have tested bets, validated impact, and a repeatable process to scale AI-driven BI across the organisation—turning early wins into a rhythm of productised, governed improvements that compound over time.

AI-driven data analytics: turn signals into revenue, retention, and resilience

Data is noisy. The trick isn’t collecting more of it — it’s turning the right signals into actions that actually move the business: more revenue, fewer customers lost, and the ability to keep running when things go wrong. That’s what “AI‑driven data analytics” does: it stitches event streams, customer context, model predictions and simple rules into a practical loop that finds problems early and suggests the next best step.

Why this matters right now: a major security incident can be painfully expensive — the average cost of a data breach was about USD 4.45M in 2023 (IBM) — and small improvements in customer retention can have outsized impact on profitability. Research first reported by Bain and summarized in Harvard Business Review shows that a 5% increase in retention can raise profits by roughly 25%–95%.

This post isn’t a theory dump. Over the next sections we’ll make this concrete: what “AI‑driven” means in 2025, the short list of use cases that pay back fast (with defendable numbers), the data and team you actually need, a 90‑day roadmap to prove ROI, and the simple controls that stop mistakes before they spread. No buzzwords — just the signals and the steps to turn them into revenue, retention, and resilience.

  • Short read, practical steps: If you want one thing to take away today, it’s how to test two high‑impact pilots in a quarter and measure real lift.
  • Why it’s safe to try: We’ll cover the guardrails buyers and regulators expect, and quick wins to reduce risk.
  • Why it matters for leaders: better decisions from real‑time signals reduce churn, lift average order value, and shorten incident lifecycles — the three levers that fund growth and protect valuation.

Ready to stop guessing and start converting signals into outcomes? Let’s walk through how to build the engine and prove it works — fast.

What AI-driven data analytics really means in 2025

From BI to AI: where analytics actually changes decisions

In 2025 the meaningful difference between “analytics” and “AI-driven analytics” is not prettier dashboards—it’s whether insights are directly changing operational choices. Traditional BI summarizes what happened; AI-driven analytics embeds prediction and prescription into workflows so that people and systems make different, measurable decisions. That means models and decision services are running alongside transactional systems, surfacing next-best actions, flagging at-risk accounts, and automating routine outcomes while leaving humans in the loop for judgment calls. The goal shifts from reporting to decision enablement: analytics becomes an active participant in day-to-day ops rather than a passive rear-view mirror.

The core loop: ingest, enrich, predict, prescribe, act

Operational AI analytics follow a tight, repeatable loop. First, diverse signals are ingested—events, logs, customer interactions, sensor telemetry and external feeds. Those raw signals are normalized and enriched with identity and context (feature construction, entity resolution, semantic embeddings). Next, inference layers produce predictions or classifications: propensity to buy, likely failure modes, sentiment trends. Then orchestration converts predictions into prescriptions: recommended next steps, prioritized worklists, pricing recommendations or automated remediation. Finally, actions are executed—via agents, product UI, or orchestration platforms—and outcomes are instrumented back into the loop so models and rules can be evaluated and retrained. The practical power comes from closing that loop rapidly and reliably so each cycle improves precision and business impact.

What counts as AI-driven today: LLMs + ML + rules working together

Real AI-driven stacks in 2025 are hybrid. Large language models handle unstructured text and conversational context, retrieval-augmented techniques ground outputs in company data, classical ML models provide calibrated numeric predictions, and deterministic rules or business logic add safety and compliance constraints. Together they form a layered decision fabric: embeddings and retrieval supply the context LLMs need; ML models quantify risk and probability; rules enforce guardrails and map outputs to permissible actions. Human oversight, provenance tracking and evaluation harnesses are part of the architecture, not afterthoughts—ensuring that automated recommendations remain auditable, explainable and aligned with policy.

Understanding these building blocks makes it easy to move from capability to value: the next step is to map them against concrete use cases and the metrics that prove ROI, so teams can prioritize pilots that ship fast and scale.

Use cases that pay back fast (with numbers you can defend)

Customer sentiment-to-action: +20% revenue from feedback, up to +25% market share

Start with the signals your customers already produce: reviews, NPS, chat transcripts, call summaries and feature usage. Train sentiment and topic models, connect them to product and marketing workflows, and run prioritized experiments that turn feedback into product tweaks, targeted campaigns and service improvements. In practice the high-impact outcomes are short-cycle: improve conversion on a page, reduce churn for a cohort, or unlock an upsell—then scale the playbook.

As evidence from our D-Lab research shows, companies that close the loop on sentiment and feedback see clear market and revenue gains: “Up to 25% increase in market share (Vorecol).” KEY CHALLENGES FOR CUSTOMER SERVICE (2025) — D-LAB research and “20% revenue increase by acting on customer feedback (Vorecol).” KEY CHALLENGES FOR CUSTOMER SERVICE (2025) — D-LAB research

GenAI call centers: +20–25% CSAT, −30% churn, +15% upsell

Deploy a lightweight GenAI layer that provides agents with a real-time context pane (customer history, sentiment, recommended responses) and an automated wrap-up that drafts follow-ups and next steps. Run the model in shadow mode first, A/B the recommendations, then allow assisted actions (suggest & approve) before fully automating routine replies. The biggest wins come from shortening handle time, improving first-contact resolution and surfacing timely upsell opportunities.

The field evidence is persuasive: “20-25% increase in Customer Satisfaction (CSAT) (CHCG).” KEY CHALLENGES FOR CUSTOMER SERVICE (2025) — D-LAB research; “30% reduction in customer churn (CHCG).” KEY CHALLENGES FOR CUSTOMER SERVICE (2025) — D-LAB research; and “15% boost in upselling & cross-selling (CHCG).” KEY CHALLENGES FOR CUSTOMER SERVICE (2025) — D-LAB research

Sales and pricing: AI agents, recommendations, dynamic pricing drive +10–50% revenue

Sales AI agents, real-time recommendation engines and dynamic pricing are classic fast-payback plays. Usecases that typically pay back quickly include: automated lead qualification and outreach (freeing reps to close), product recommendation widgets in checkout, and price optimization for time-limited demand or enterprise negotiations. Start small—pilot an AI agent for lead qualification and a recommendation experiment on a single product family—then measure close rate, AOV and CAC payback.

Conservative pilots commonly show step-change improvements: AI sales augmentation reduces seller time on manual tasks, raises conversion, and shortens cycle time; recommendation engines lift AOV and retention; and properly instrumented dynamic pricing captures demand elasticity without damaging trust. These levers compound when combined across the funnel.

Manufacturing and supply chains: −50% downtime, −25% supply chain cost, +30% output

Predictive maintenance and supply-chain optimization are among the fastest routes to ROI for industrials. Begin by instrumenting a small set of critical assets and one inventory flow, run anomaly-detection and root-cause models, and feed prescriptive alerts to planners and technicians. Pair model-driven alerts with a fast-response playbook so the business converts detections into repairs and routing changes quickly.

D-Lab evidence highlights the scale of these gains: “Production Output Uplift: Predictive maintenance and lights-out factories boost efficiency (+30%), reduce downtime (-50%), and extends machine lifetime by 20-30%.” Portfolio Company Exit Preparation Technologies to Enhance Valuation — D-LAB research and “Inventory & supply chain optimization tools reduce supply chain disruptions (-40%) and supply chain costs (-25%).” Portfolio Company Exit Preparation Technologies to Enhance Valuation — D-LAB research

Security analytics that wins deals: ISO 27002, SOC 2, NIST 2.0 as conversion assets

Security and compliance analytics are not only risk controls—they are commercial differentiators. Embedding security telemetry, automated evidence collection and continuous posture checks into your analytics stack shortens sales cycles with enterprise customers and reduces friction during diligence. Treat compliance frameworks as conversion assets: instrument controls, show measurable SLAs, and bake auditability into your ML/LLM pipelines so security becomes a competitive claim in RFPs.

Across these five plays, the common recipe is the same: pick a narrow use case, instrument outcomes, run controlled experiments, and automate the loop that converts insight into action. With that discipline, pilots move from proof-of-concept to repeatable revenue and resilience within a single quarter—setting you up to invest in the data, people and controls that make scaling predictable and safe.

Build the engine: data, people, and controls for AI-driven analytics

The data you actually need: events, identities, sentiment, usage

Focus on the minimum data that turns signals into decisions. That means high-fidelity event streams (user actions, API calls, sensor telemetry), a reliable identity layer (customer and device resolution across systems), product and feature usage metrics, and centralized capture of unstructured feedback (chat, support transcripts, reviews) that you can index and embed for retrieval. Prioritize consistent schemas, strong timestamps, and immutable event logs so you can re-run feature engineering and audits.

Practical steps: instrument critical journeys first (signup, purchase, support escalation); deploy data contracts that lock down event shapes and SLAs between producers and consumers; build a lightweight feature store for reuse; and store embeddings or annotated text alongside structured facts so LLMs and retrieval systems have deterministic context to ground their outputs. Those moves turn raw signals into repeatable inputs for prediction and prescription.

Guardrails buyers and regulators expect: ISO 27002, SOC 2, NIST 2.0

Security, privacy and evidentiary controls are table stakes when analytics touches customer or IP data. Implement data classification and minimization (keep PII out of model training where possible), enforce role-based access and least privilege, encrypt data at rest and in transit, and maintain immutable audit logs that link model outputs back to input snapshots and decision timestamps. Automate evidence collection so you can demonstrate controls without manual rework.

If you need reference frameworks for program design, start from the primary standards and guidance: ISO/IEC 27001 and the broader 27000 family (see ISO overview at https://www.iso.org/standard/27001), the SOC 2 guidance for service organizations (AICPA resources: https://www.aicpa.org/interestareas/frc/assuranceadvisoryservices/soc.html), and NIST’s public cybersecurity resources (https://www.nist.gov/topics/cybersecurity). Use those frameworks as negotiation points with buyers—controls mapped to an existing standard reduce friction in procurement and diligence.

Team and rituals: analytics translator + domain SMEs + prompt/data engineers

Structure your org around outcomes, not job titles. A lean, high-output squad typically pairs: an analytics translator (bridges product/ops and data science), domain SMEs (product, sales, ops), one or two data engineers to own pipelines and contracts, a prompt/data engineer who curates retrieval layers and prompt templates, and an ML engineer or MLOps lead to productionize models and monitor drift. Product and security stakeholders must be embedded to approve risk thresholds and runbooks.

Adopt rituals that keep experiments honest: weekly deployment/experiment reviews, a decision registry (who approved what model for which workflow), quarterly model-risk assessments, and a public-runbook for incidents (false positives, hallucinations, data outages). Make A/B testing and shadow-mode rollouts standard for any automated recommendation or pricing change—start with assistive suggestions and graduate to closed-loop actions only after measured wins and stable telemetry.

Buy vs. build: pick a stack that ships (BigQuery/Vertex, Snowflake/Snowpark, Databricks + CX tools)

Choose platform primitives that let teams move from prototype to production without rebuilding plumbing. Managed data warehouses with integrated compute and ML (e.g., BigQuery + Vertex AI, Snowflake + Snowpark, Databricks) shorten time to value; pair them with CX and orchestration tools that already integrate with your CRM, ticketing and messaging systems. Avoid bespoke end-to-end rewrites early—favor composable building blocks, well-documented APIs and a clear path to vendor exit if needed.

Operational priorities for the stack: automated lineage and observability, cost governance and query controls, reproducible model training (versioned datasets and code), a feature store or shared feature layer, and secure secret & key management. Invest in a small set of integration adapters (CRM, event bus, support platform) so pilots can graduate to live use cases with minimal additional engineering.

When these pieces are in place—sane instrumentation, mapped controls, a compact cross-functional team and a pragmatic stack—you move from experimentation to predictable impact. The next step is to translate this engine into a timebound plan that proves ROI quickly and creates the cadence for scaling.

Thank you for reading Diligize’s blog!
Are you looking for strategic advise?
Subscribe to our newsletter!

90-day roadmap to prove ROI from AI-driven data analytics

Weeks 0–2: baseline NRR, CSAT, churn, AOV; instrument key journeys

Start by agreeing the business metrics you will defend: net revenue retention (NRR), CSAT, churn rate, average order value (AOV), cost-to-serve and any pipeline KPIs. Capture a 4–8 week baseline so change is attributable and seasonal noise is visible.

Simultaneously instrument the minimum viable telemetry: event streams for the critical journeys (signup, onboarding, purchase, support), deterministic identity keys, and a single source of truth for transactions and tickets. Implement data contracts for producers, schema validation, and one lightweight dashboard that surfaces baseline values and data health (missing events, schema drift, late-arriving data).

Finish the sprint with prioritized hypotheses (1–3) that link a use case to a measurable outcome (e.g., reduce churn for X cohort by Y% or increase AOV by Z%) and a clear success criterion and sample-size estimate for A/B tests.

Weeks 3–6: pilot two use cases with shadow decisions and A/B tests

Pick two high-probability, fast-payback pilots (one customer-facing, one operational) that reuse the instrumentation you already built. Typical choices: sentiment-to-action for a high-value cohort, or an assisted-recommendation for checkout.

Run models and LLM-enabled recommendations in shadow mode first: capture the decision, the model score, and the human/agent outcome without changing the experience. Use that data to calibrate thresholds, reduce false positives, and build trust with stakeholders.

Once shadow runs look stable, convert one pilot to an A/B test with guardrails: allocate traffic, log exposures, and ensure rollback paths. Measure primary and secondary outcomes daily and run statistical checks at pre-defined intervals. Keep experiment windows short but statistically valid—typically 2–6 weeks depending on traffic and conversion rates.

Weeks 7–12: automate the winning loop; operational runbooks and alerts

Promote the winning variant into a controlled automation: integrate model outputs into orchestration (workflow engine, CRM action, or automated patching workflow) with clear acceptance criteria and a human-in-the-loop where risk is material. Ensure any automated action is reversible and documented.

Deliver operational runbooks: expected inputs, when to intervene, SLAs, and a decision registry (who approved the automation, what version of model/data was used). Implement monitoring for performance and safety: model accuracy, business-metric impact, latency, and a small set of business alerts (e.g., sudden drop in conversion lift, surge in false positives).

Set retraining and review cadences (weekly metric review during ramp, monthly model-risk review thereafter) and wire incident response so engineers and product owners can triage data, model, or infrastructure failures quickly.

Prove value: NRR, pipeline lift, cycle time, cost-to-serve, payback period

Translate model-level wins into financial terms. Examples of the conversion steps you should document: incremental revenue from recovered at-risk customers (NRR uplift), incremental deals or deal size (pipeline lift), time saved in handle time or cycle time (operational cost reductions) and direct decreases in cost-to-serve. Use conservative attribution windows (30–90 days) and report gross lift, net lift (after costs), and estimated payback period.

Create a one-page ROI memo for stakeholders with: baseline vs. pilot metric delta, unit economics (value per recovered account / value per extra order), total cost of pilots (engineering, tooling, inference costs, subscription fees), and recommended next investments if results meet thresholds. That memo becomes the investment case to expand the program.

With the ROI case documented and automated routines in place, the natural next step is to harden controls and monitoring so the system can scale safely and predictably—addressing the operational and compliance gaps you’ll inevitably encounter as you broaden deployment.

Avoid these risks (and how to de-risk them quickly)

Bad data → bad answers: quality gates, lineage, and observability

Bad models start with bad inputs. Put simple, enforceable quality gates at ingestion (schema validation, null-rate checks, cardinality limits) and add realtime alerting for broken producers. Version and catalog datasets so teams can see where features came from and when they changed—automated lineage makes root-cause investigations fast.

Practical quick wins: add producer-side data contracts, a lightweight feature store for shared definitions, daily data-health checks surfaced on a single dashboard, and a “canary” dataset that runs through the full pipeline each deploy. These steps reduce firefighting time and ensure your models are fed consistent, auditable inputs.

Hallucinations and bias: retrieval grounding, eval harnesses, human-in-the-loop

For LLMs and retrieval-augmented systems, hallucinations come from poor grounding and ambiguous prompts; bias emerges from skewed training or feedback loops. Reduce both by designing deterministic grounding layers (retrieval + citations) and by constraining model outputs with rule-based filters for safety-critical fields.

Operationalize an evaluation harness: automated unit tests for common prompts, synthetic adversarial tests, and continuous evaluation against labelled benchmarks. Keep humans in the loop for edge cases—use assistive modes first (suggest & approve), escalate to automated actions only after repeated, measurable success. Record feedback and use it to retrain or adjust retrieval boundaries so the system learns what to avoid.

Privacy and security: PII minimization, role-based access, audit trails

Privacy and compliance are non-negotiable when models see customer data. Apply PII minimization and pseudonymization before training or retrieval; enforce strict role-based access controls and short-lived credentials for inference pipelines. Maintain immutable audit trails that map inputs, model versions, and outputs to decisions so you can reconstruct any outcome.

“The average cost of a data breach in 2023 was $4.24M and GDPR fines can reach up to 4% of revenue — making ISO 27002/SOC 2/NIST compliance vital to de-risking customer data and IP.” Portfolio Company Exit Preparation Technologies to Enhance Valuation — D-LAB research

Quick remediation checklist: run a data inventory and classification, remove or obfuscate PII from non-essential flows, enable encryption in transit & at rest, and automate evidence collection for audits. Map your controls to a recognized framework (ISO 27002, SOC 2, NIST) to accelerate procurement and due diligence.

Model drift and decay: monitor, retrain, rollback policies

Models degrade in production. Detect that early by monitoring both data drift (feature distribution changes) and concept drift (prediction vs. label performance). Instrument and store scoring inputs and outcomes so you can compare live performance to training baselines.

Fast de-risk tactics: run models in shadow mode before full rollout, introduce canary traffic slices, define retraining triggers (metric thresholds, time windows), and implement automated rollback when a safety or performance alarm fires. Maintain model and data versioning, and keep a lightweight governance log showing who approved which model and when—this shortens mean-time-to-recovery for regressions.

Adopt these pragmatic controls early: quality gates, grounding + eval harnesses, privacy-first data handling, and continuous monitoring. They turn unknown risks into standard operating procedures—so pilots scale into reliable, auditable programs without expensive surprises.